Nike Adidas Puma New Balance Reebok Fila Converse Vans Under Armour Levi's Skechers Dickies Lacoste Crocs Guess Zara The North Face Tommy Hilfiger Calvin Klein Champion Columbia Salomon Kappa Anta Li-Ning Nike Adidas Puma New Balance Reebok Fila Converse Vans Under Armour Levi's Skechers Dickies Lacoste Crocs Guess Zara The North Face Tommy Hilfiger Calvin Klein Champion Columbia Salomon Kappa Anta Li-Ning
Trusted Wholesale Partner Since 2020

Premium Sports Brands Wholesale & Inventory Clearance

Connecting global retailers with authentic Nike, Adidas, Under Armour, Puma, New Balance and more — at factory-direct prices. From overstock lots to closeout pallets, we deliver quality inventory that moves fast.

500+
Global Clients
30+
Countries Served
5+
Years Experience
🟠

Authentic Brands

100% genuine products from Nike, Adidas, Under Armour and more

🔥

Closeout Deals

Overstock & clearance lots at below-wholesale prices

Nike Adidas Puma UA

+ 20 more brands

Premium Winter Collection

High-quality fashionable down jacket collection — combining warmth with trend-driven design. From streetwear to business casual, meeting diverse market needs across all seasons.

Inventory Industry News & Market Intelligence

Stay ahead with the latest developments in brand footwear, apparel inventory and global trade.

📊 INDUSTRY ANALYSISThe Essence of Inventory Trading: Why Information Advantage Outweighs Inventory Holding
📅 June 2, 2026

📊 IN-DEPTH ANALYSIS: A reflection on the essence of inventory trading — why information advantage outweighs inventory holding in non-standard goods markets.

Executive Summary

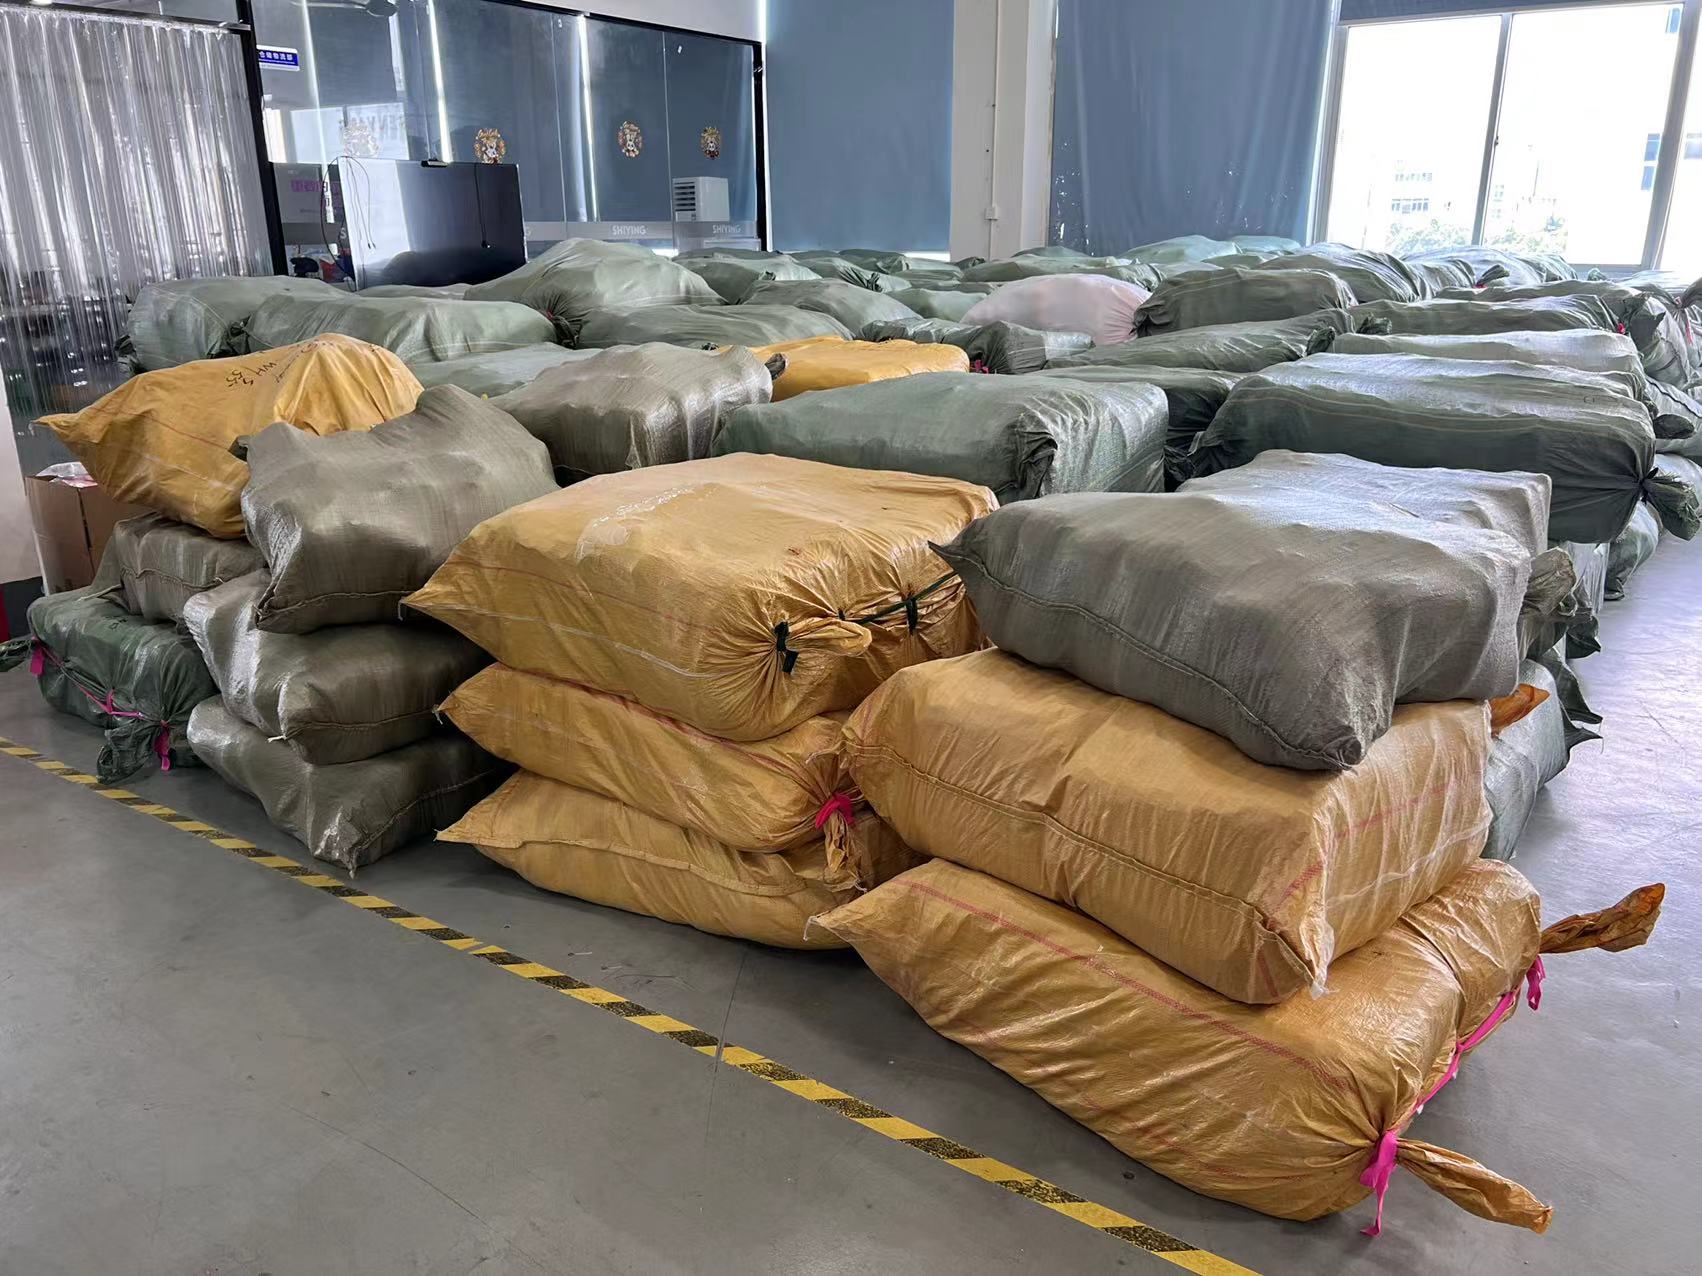
For a long time, the inventory trading industry has held a deep-rooted misconception: "Whoever holds more inventory is the industry king." This mindset stems from the industrialization-era scale logic — as long as you have goods, you can sell; with channels, you can win. However, when we focus on the branded inventory surplus market of the 2020s, a distinctly different truth emerges: inventory products are essentially specific non-standard goods, and what truly creates competitive advantage are those players who master the "invisible inventory" — that is, critical inventory information resources.

This report's core arguments are threefold:

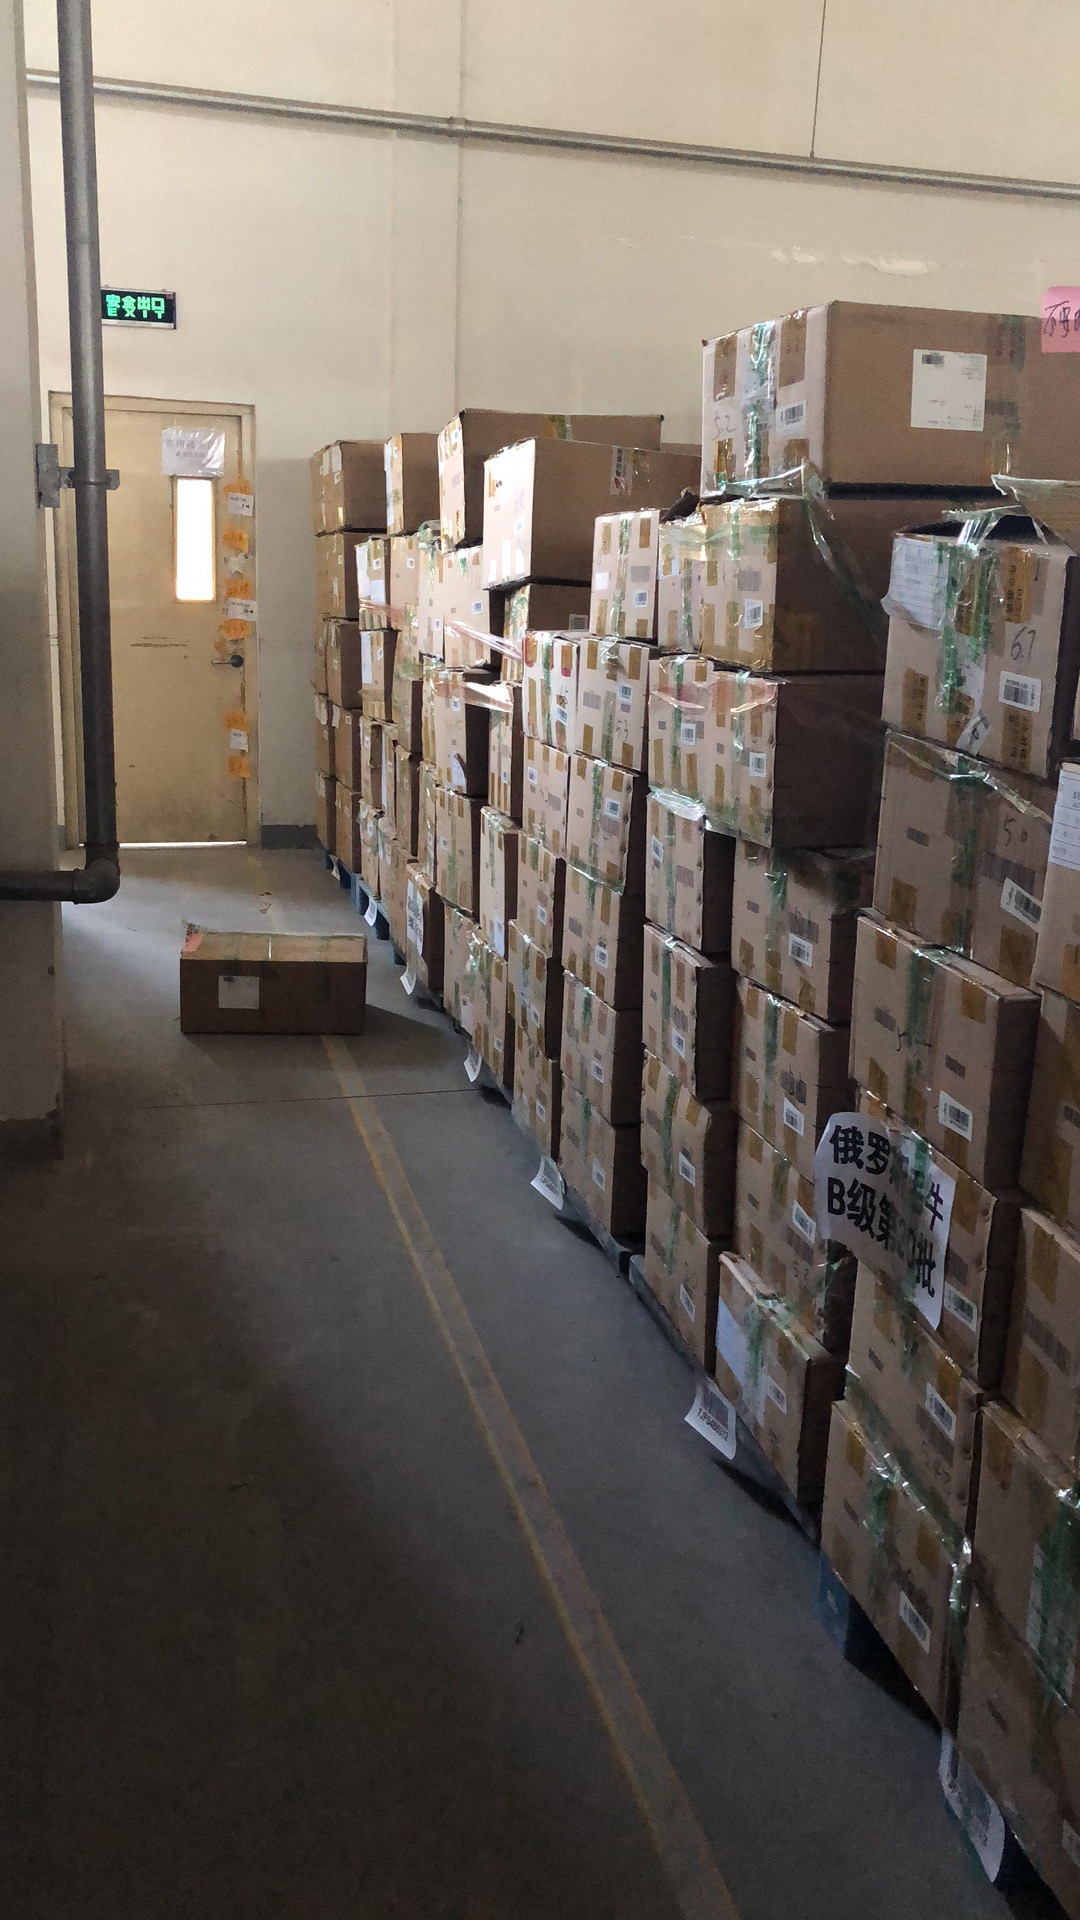
  1. Inventory products are non-standard: Each batch of inventory is a unique "time capsule," carrying a complex combination of specific brand, production batch, size distribution, channel source, and quality status — not to be summarized by a standardized SKU label.
  2. Information resources outweigh physical inventory: In a buyer's market with oversupply, knowing "where the goods are" is only basic skill; knowing "when this batch will be released," "who is in urgent need to sell," "what condition is most favored by the market," and "where the price floor is" — that is the real differentiated competitiveness.
  3. Do not worship inventory holders: Wholesalers holding inventory are not the "god" of the supply chain; they are often passive bearers of inventory overstock, capital tightness, and information lag. Advanced players have long transformed into information service providers, using information to connect upstream and downstream, using data to predict trends, rather than simply hoarding goods and waiting to sell.

These three arguments collectively point to one conclusion: In the second half of branded inventory trading, the winning move is not in the warehouse, but in the database.

Introduction: A Counterintuitive Industry Reality

The branded apparel and footwear inventory market in 2026 is undergoing profound structural changes.

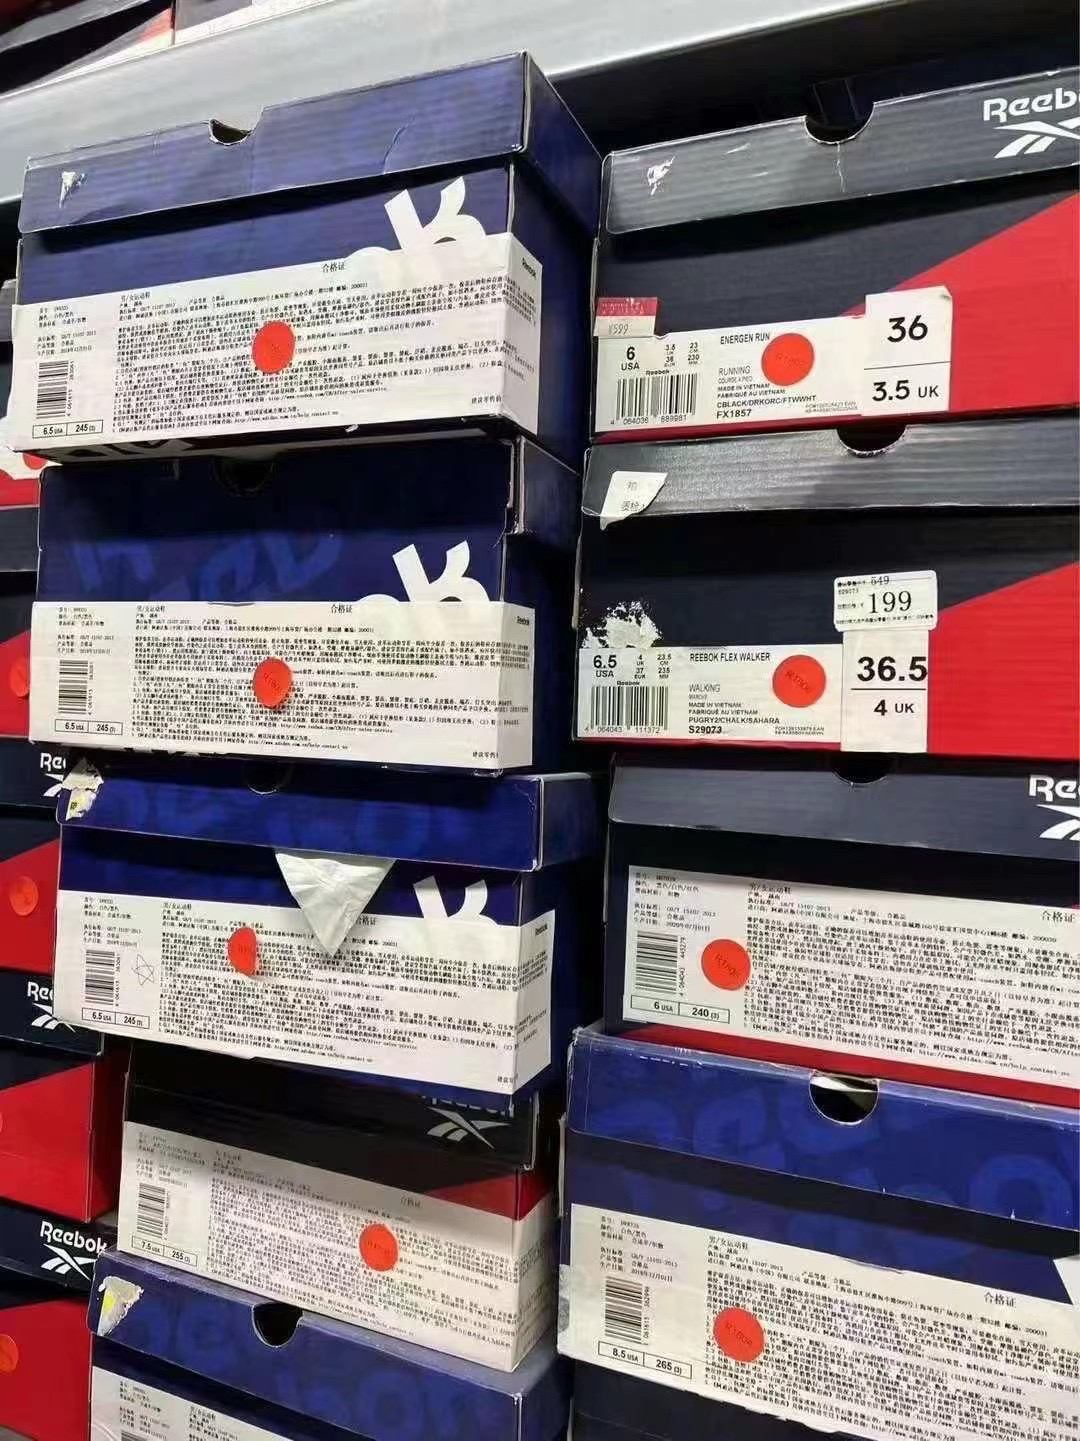
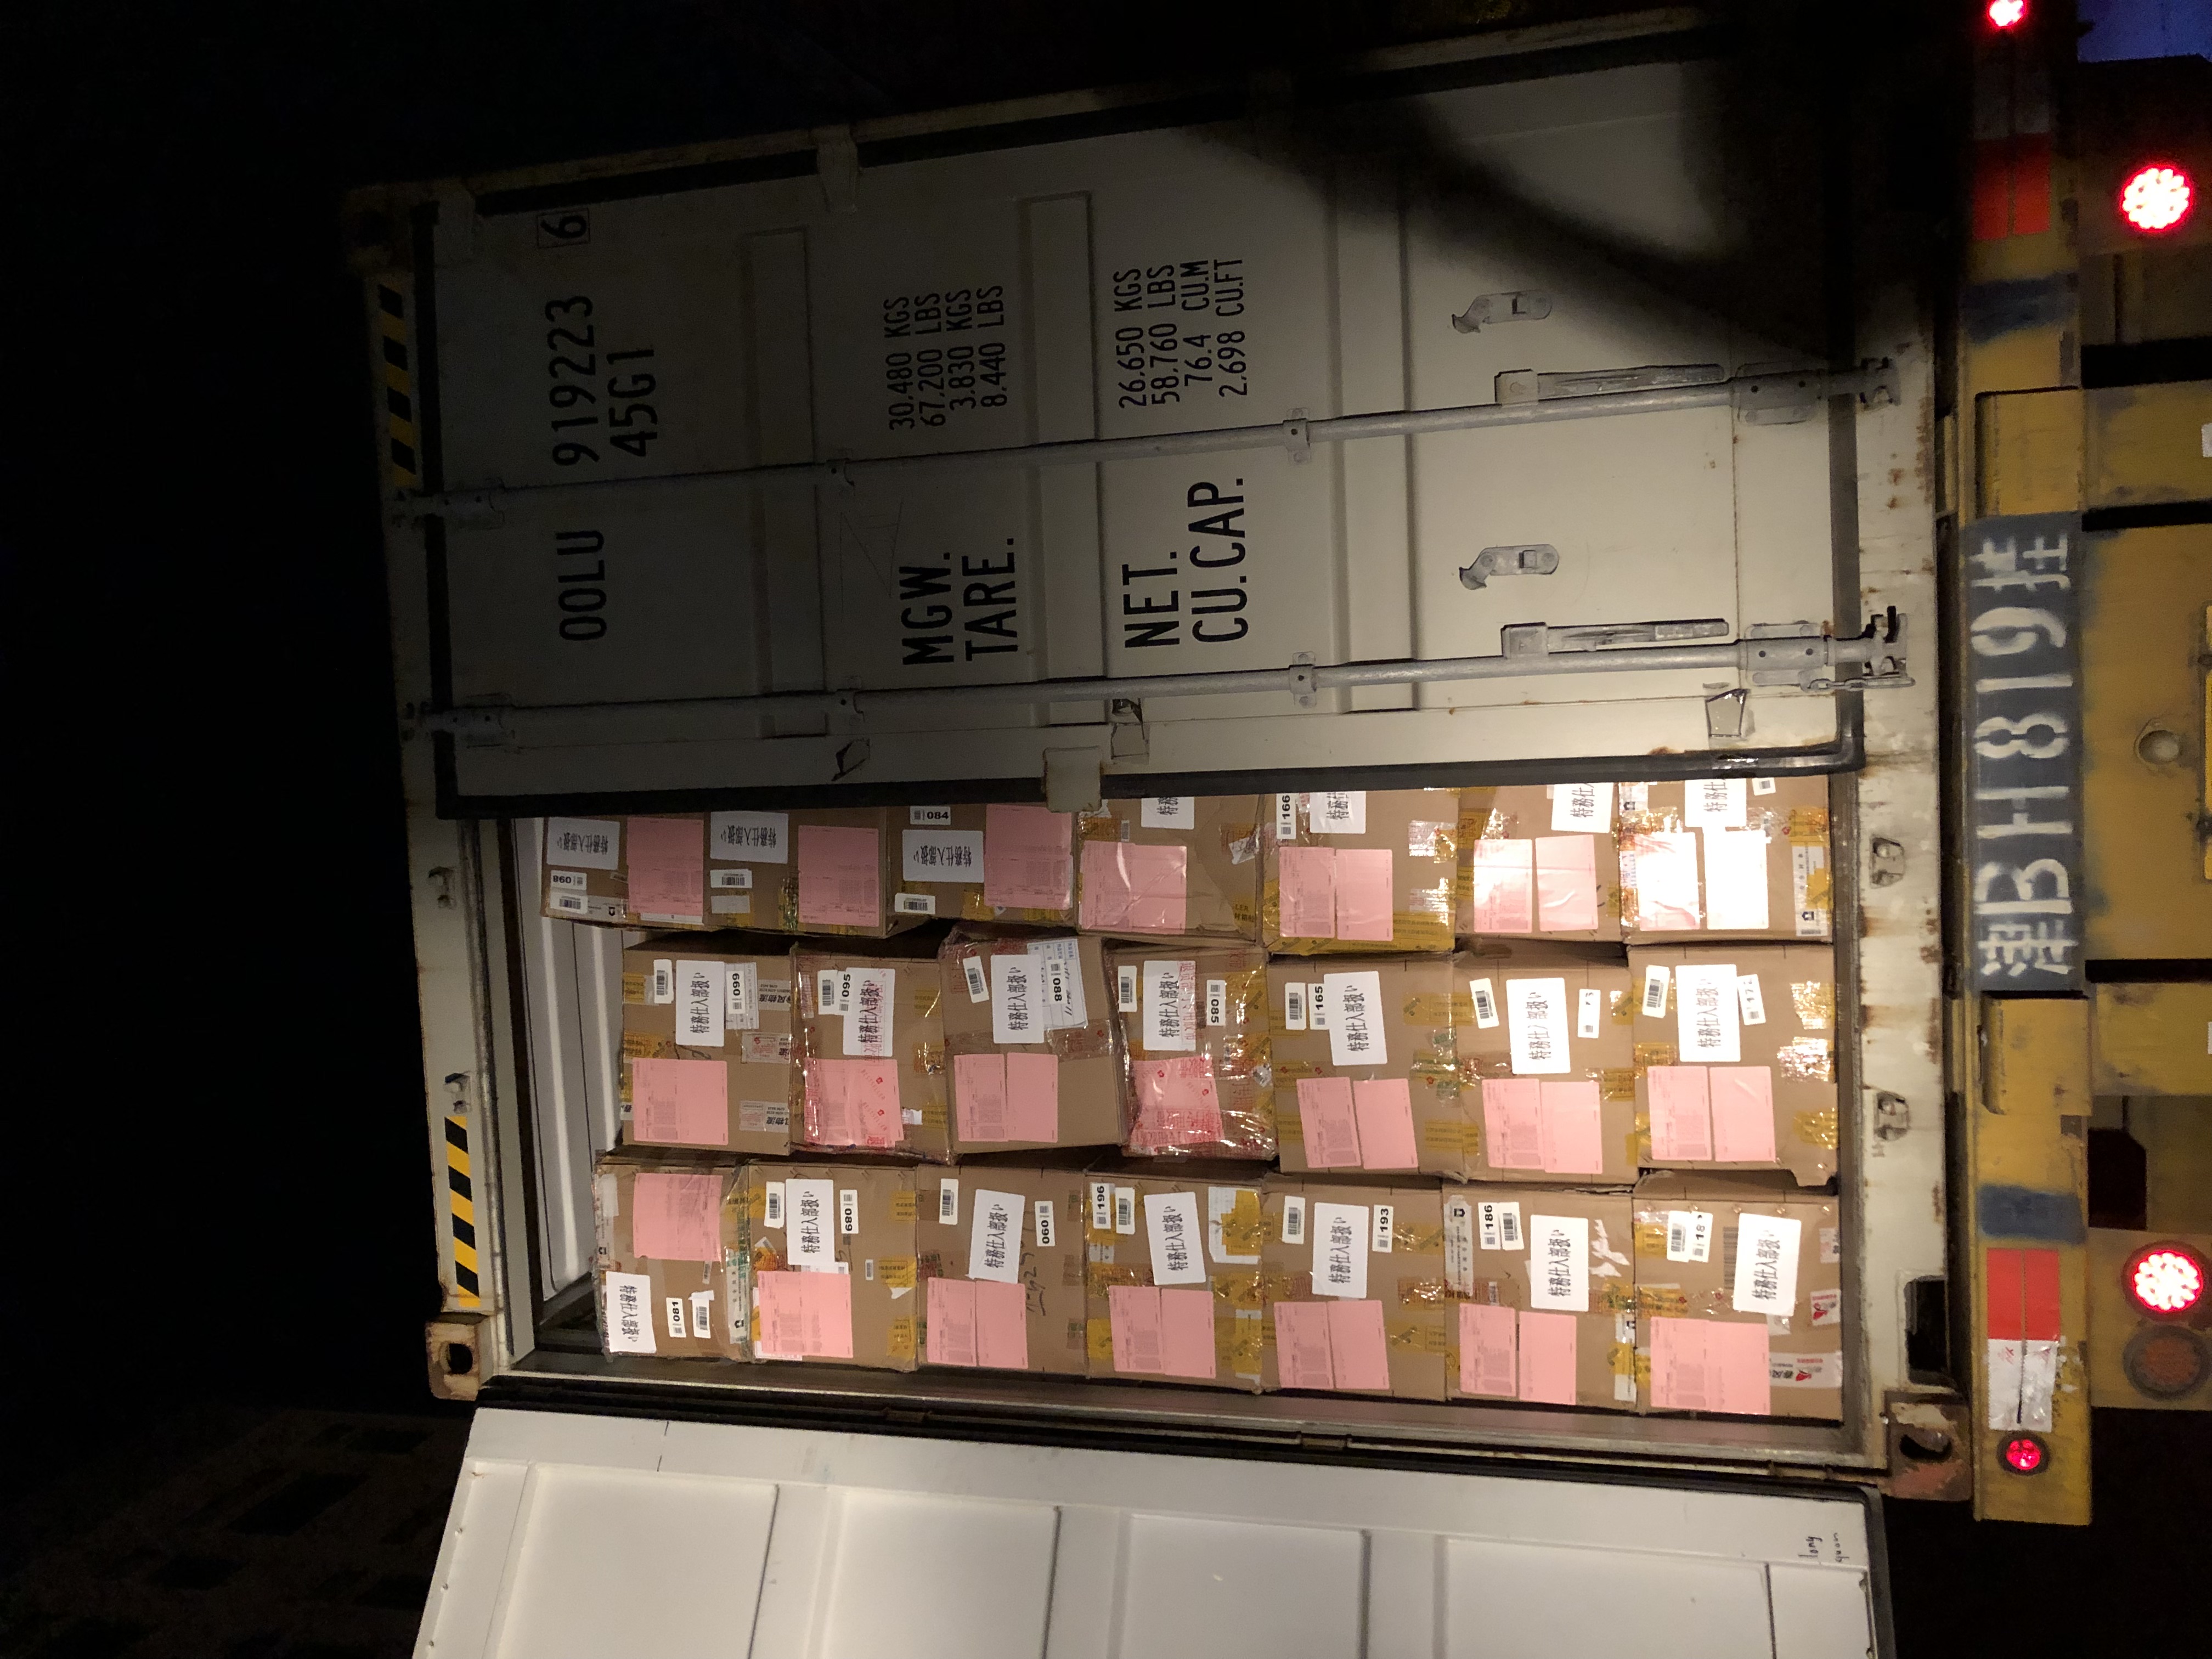
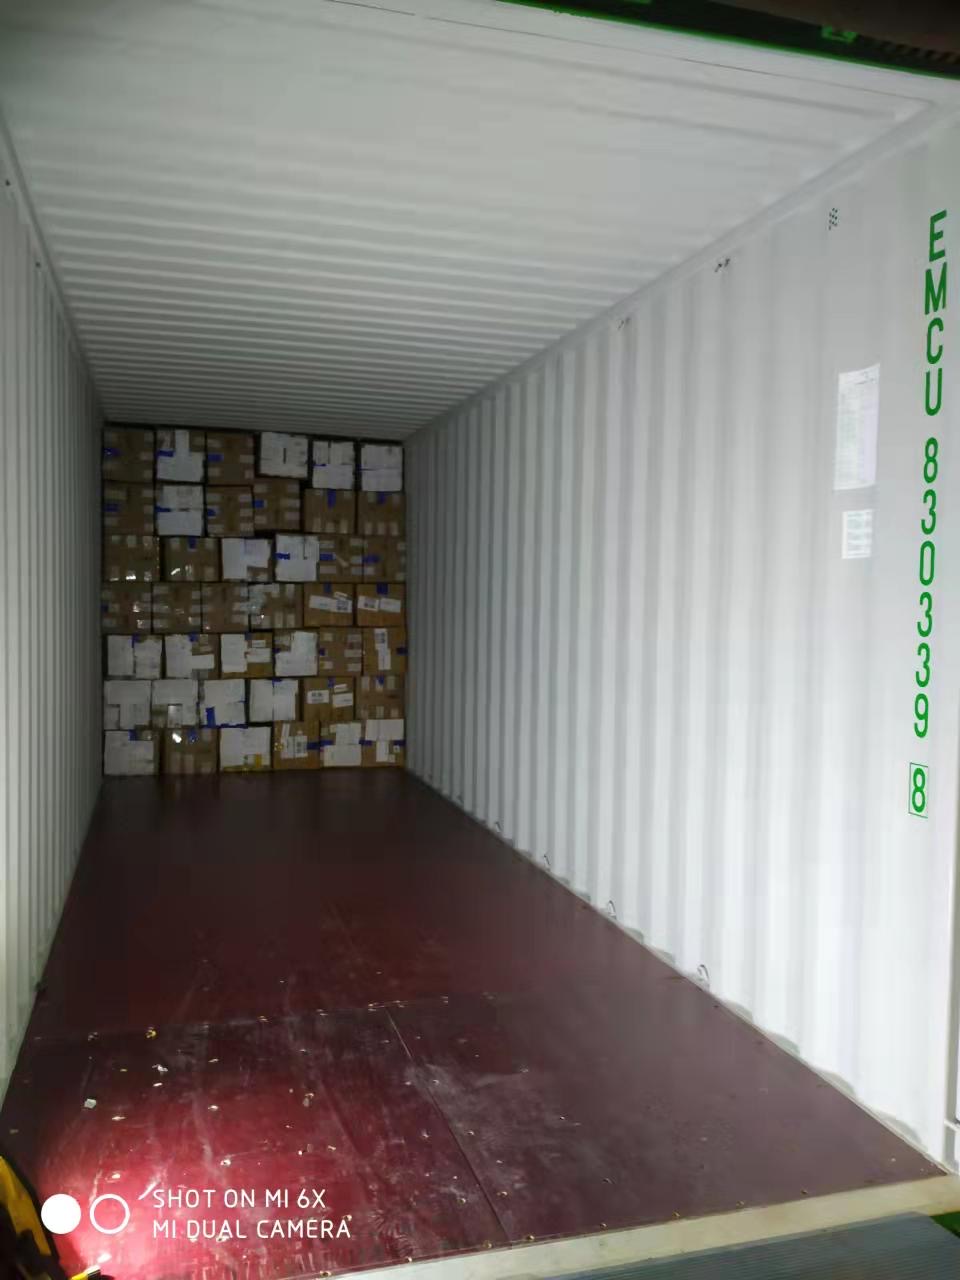
On one hand, global supply chain restructuring has brought unprecedented "inventory surplus" pressure. Southeast Asian factories have seen energy costs soar to more than 3 times 2022 levels, localized production capacity has been forced to shrink, and brand owners' off-season inventory continues to accumulate. On the other hand, the fragmentation of e-commerce channels has led to a sharp amplification of "information noise" — the same Nike sneakers may simultaneously exist in 10 different distribution channels, with prices ranging from authentic proxy purchases to "original surplus goods" to Putian replicas, presenting a complex distribution across a spectrum.

In such a market, the traditional "buy low, sell high" trading logic is failing. A wholesaler holding 100,000 authentic Adidas surplus items may be unable to sell them because they do not know the specific channel source of this batch (OEM surplus vs. brand direct procurement vs. dealer clearance), cannot provide a credible authorization chain to buyers, and ultimately stagnates in hand. Meanwhile, an "asset-light" player with only 500,000 yuan in working capital, if deeply knowledgeable about the following information combination: a brand is about to launch a global tag-removal promotion in Q3, a channel's procurement manager is looking for supplementary supply of specific categories, and a third-tier city dealer is willing to accept cash transactions slightly above market price — they can use this 500,000 yuan to leverage 5 million yuan in business, with profits far exceeding that wholesaler holding 100,000 items of stagnant inventory.

This is what this report reveals: The essence of inventory trading is no longer "trading," but "information service."

Chapter 1: Why Inventory Products Are "Specific Non-Standard Goods"

1.1 The Myth of Standard Goods

Before discussing inventory products, we need to clarify a prerequisite concept: what are standard goods?

Standard goods in the economic sense refer to commodities that are uniform in quality, highly substitutable, and transparent in pricing. For example, iron ore, crude oil, and industrial standard parts in commodity markets — their characteristics can be defined by clear specification indicators (composition content, model dimensions, performance parameters), and both trading parties focus on "whether this batch of goods meets specifications," not "which manufacturer produced these goods."

However, branded inventory products stand exactly on the opposite side of standard goods.

1.2 The Four-Dimensional Attributes of Non-Standard Goods

Branded inventory products are typical "specific non-standard goods," whose non-standard attributes are reflected in the following four dimensions:

First Dimension: Non-Homogeneity of Brand and Channel.

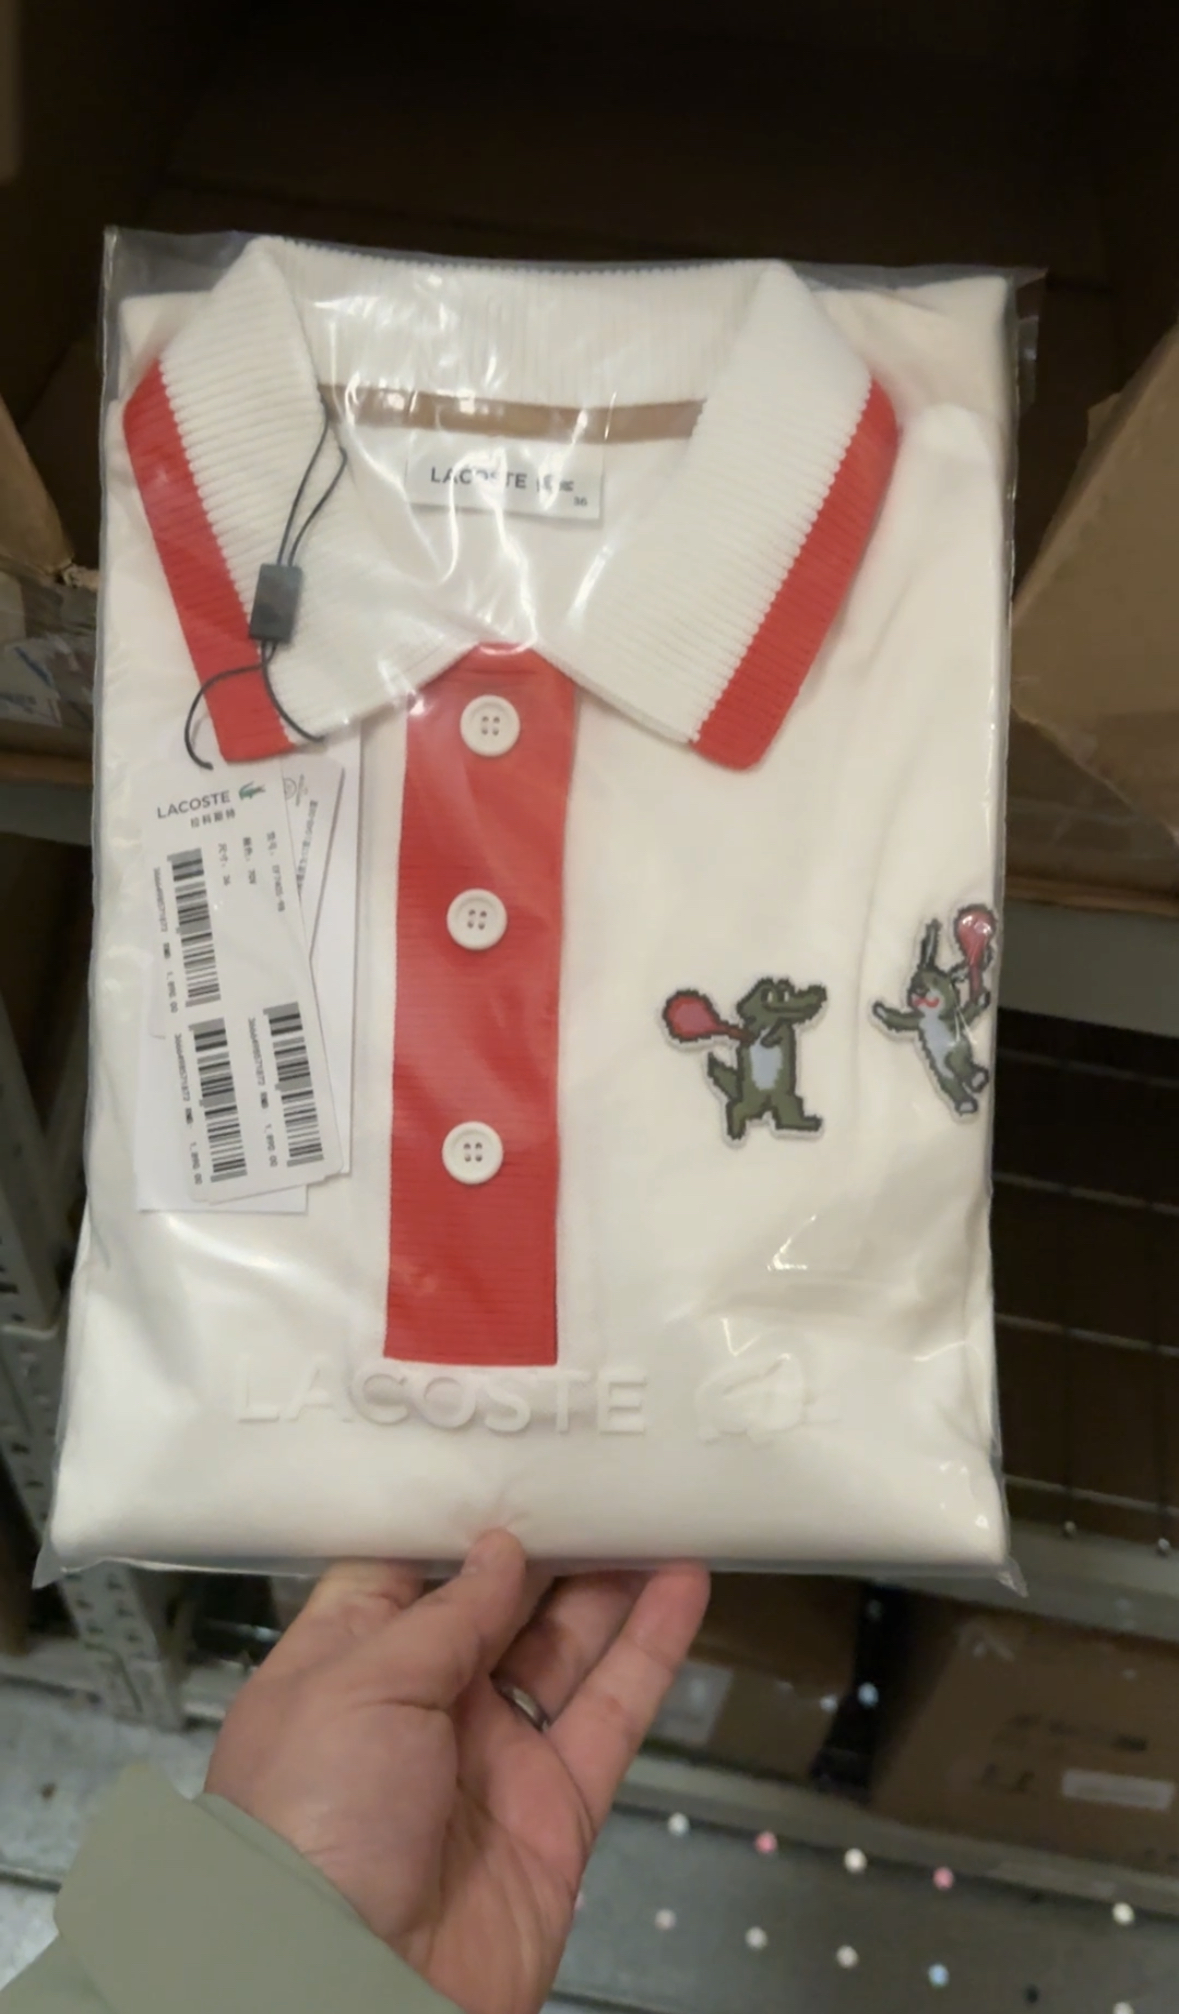
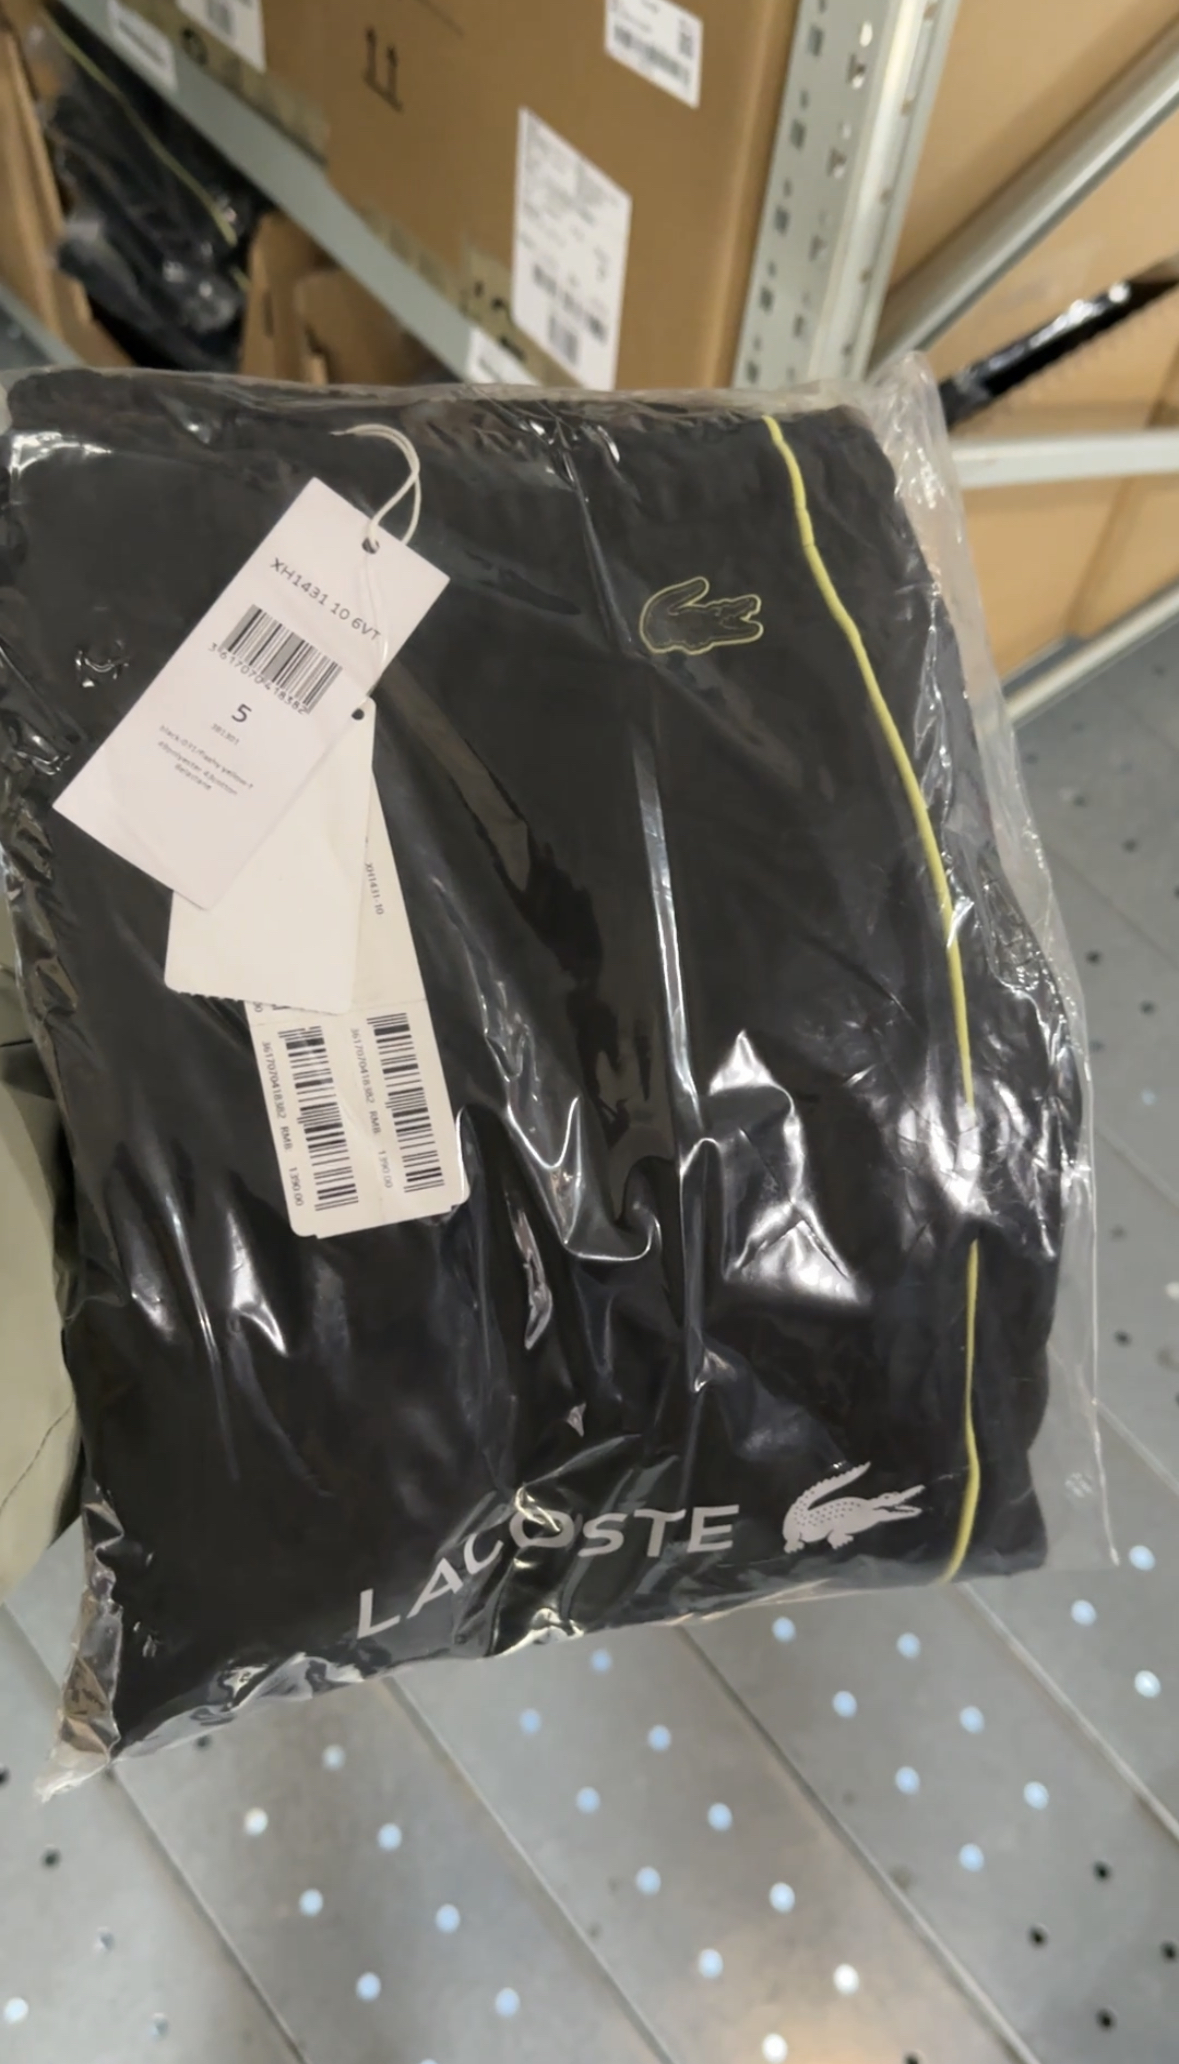
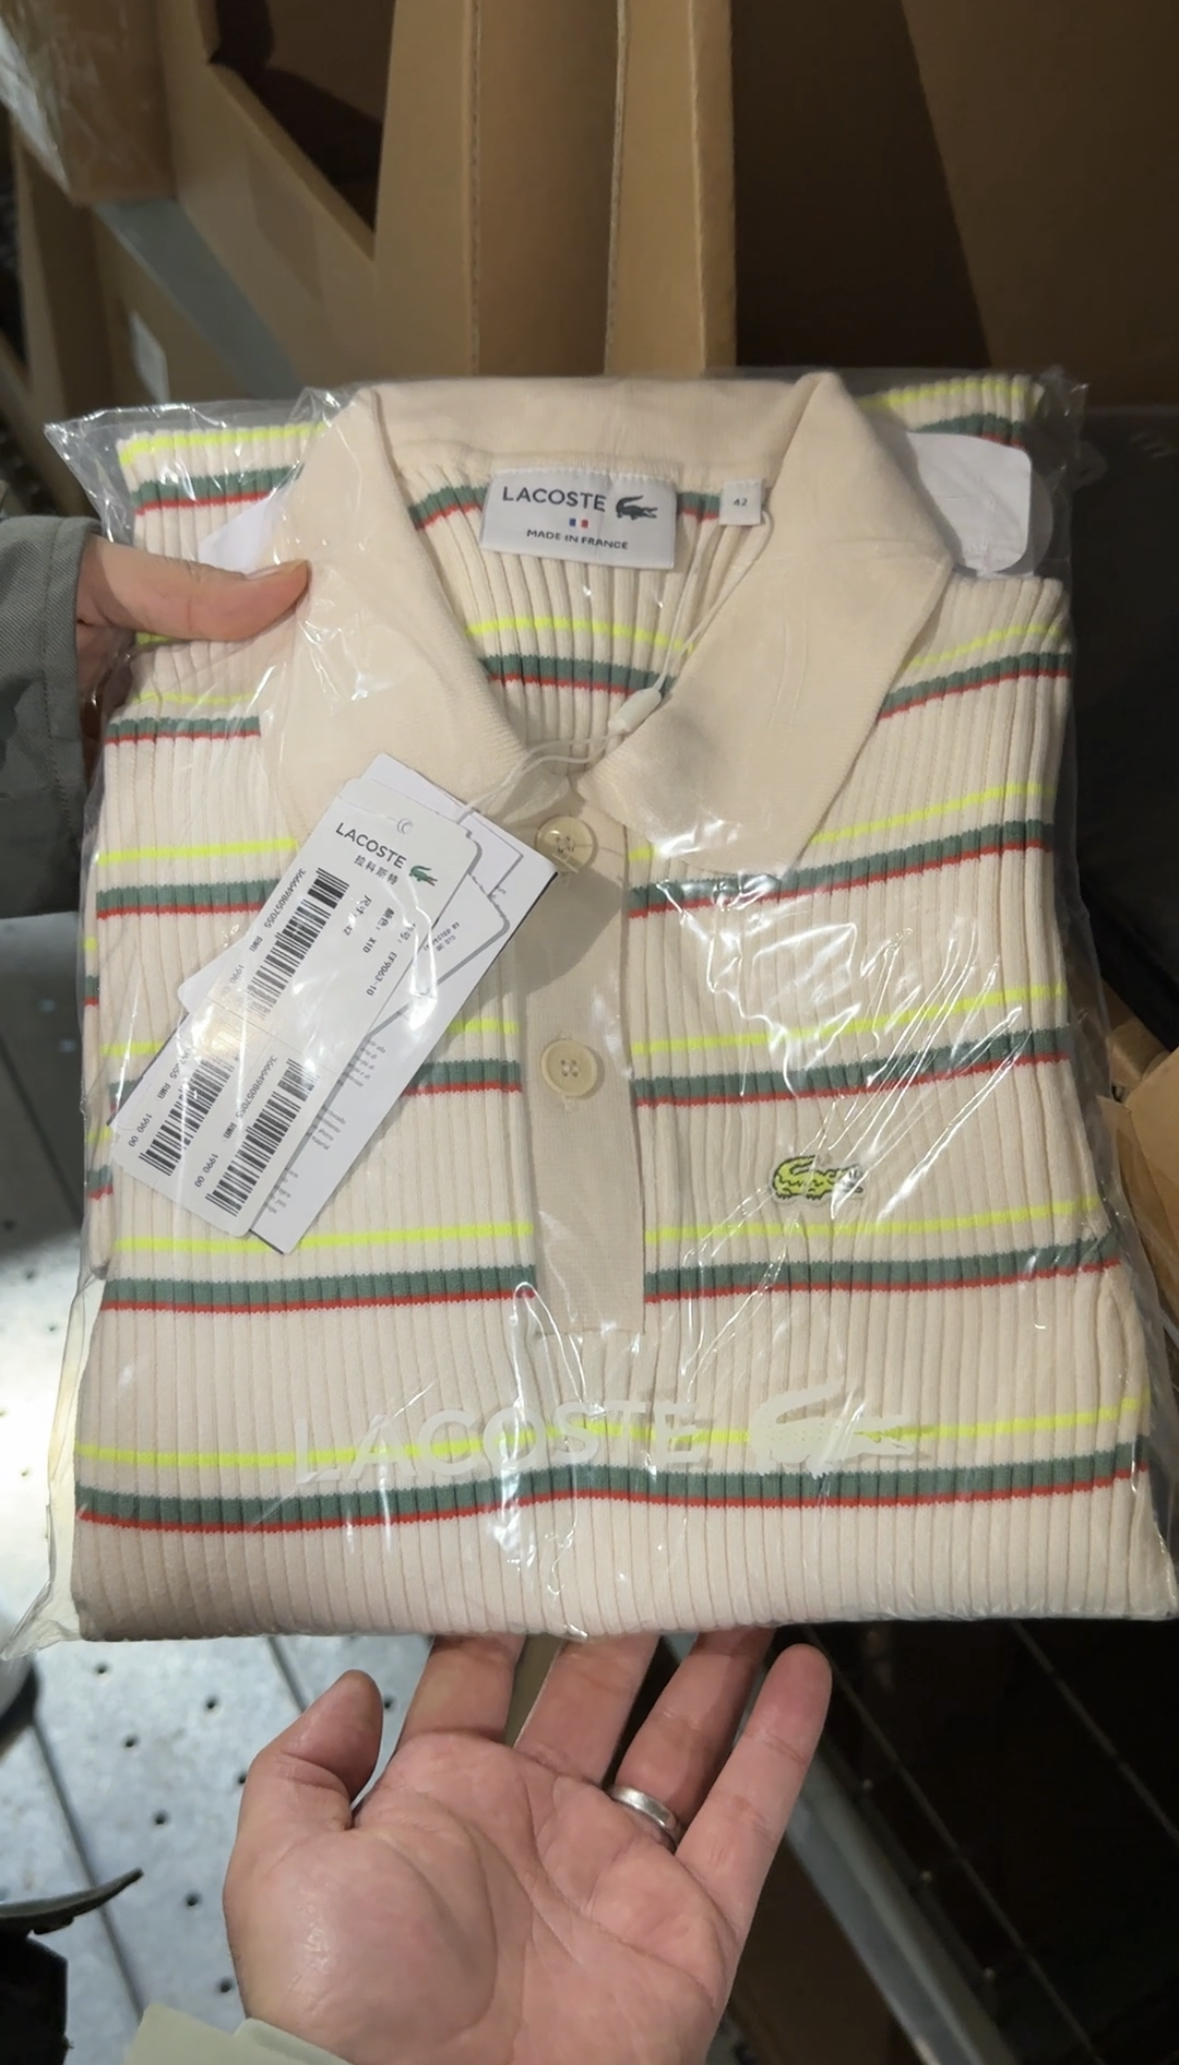
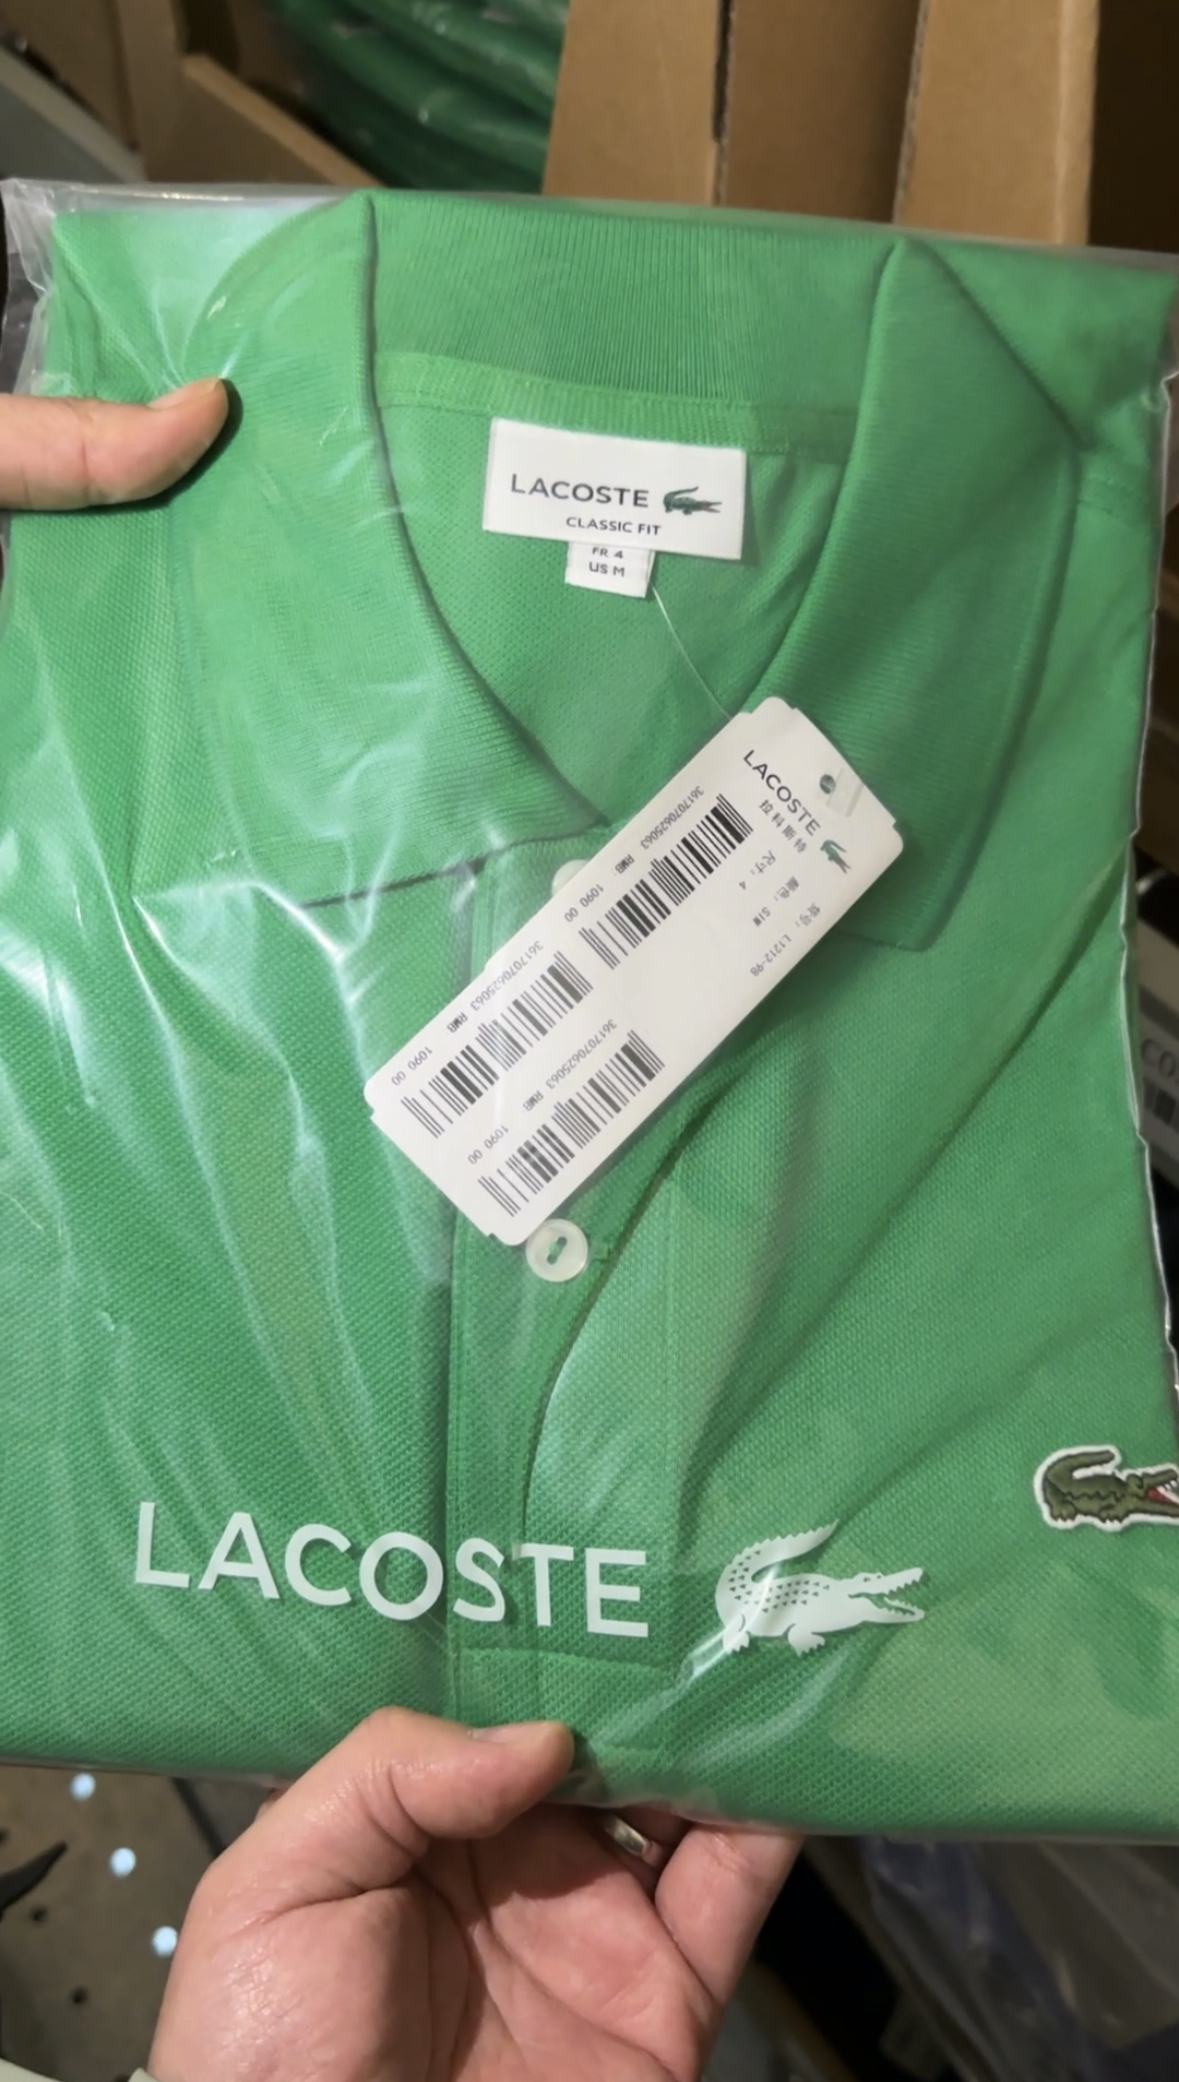
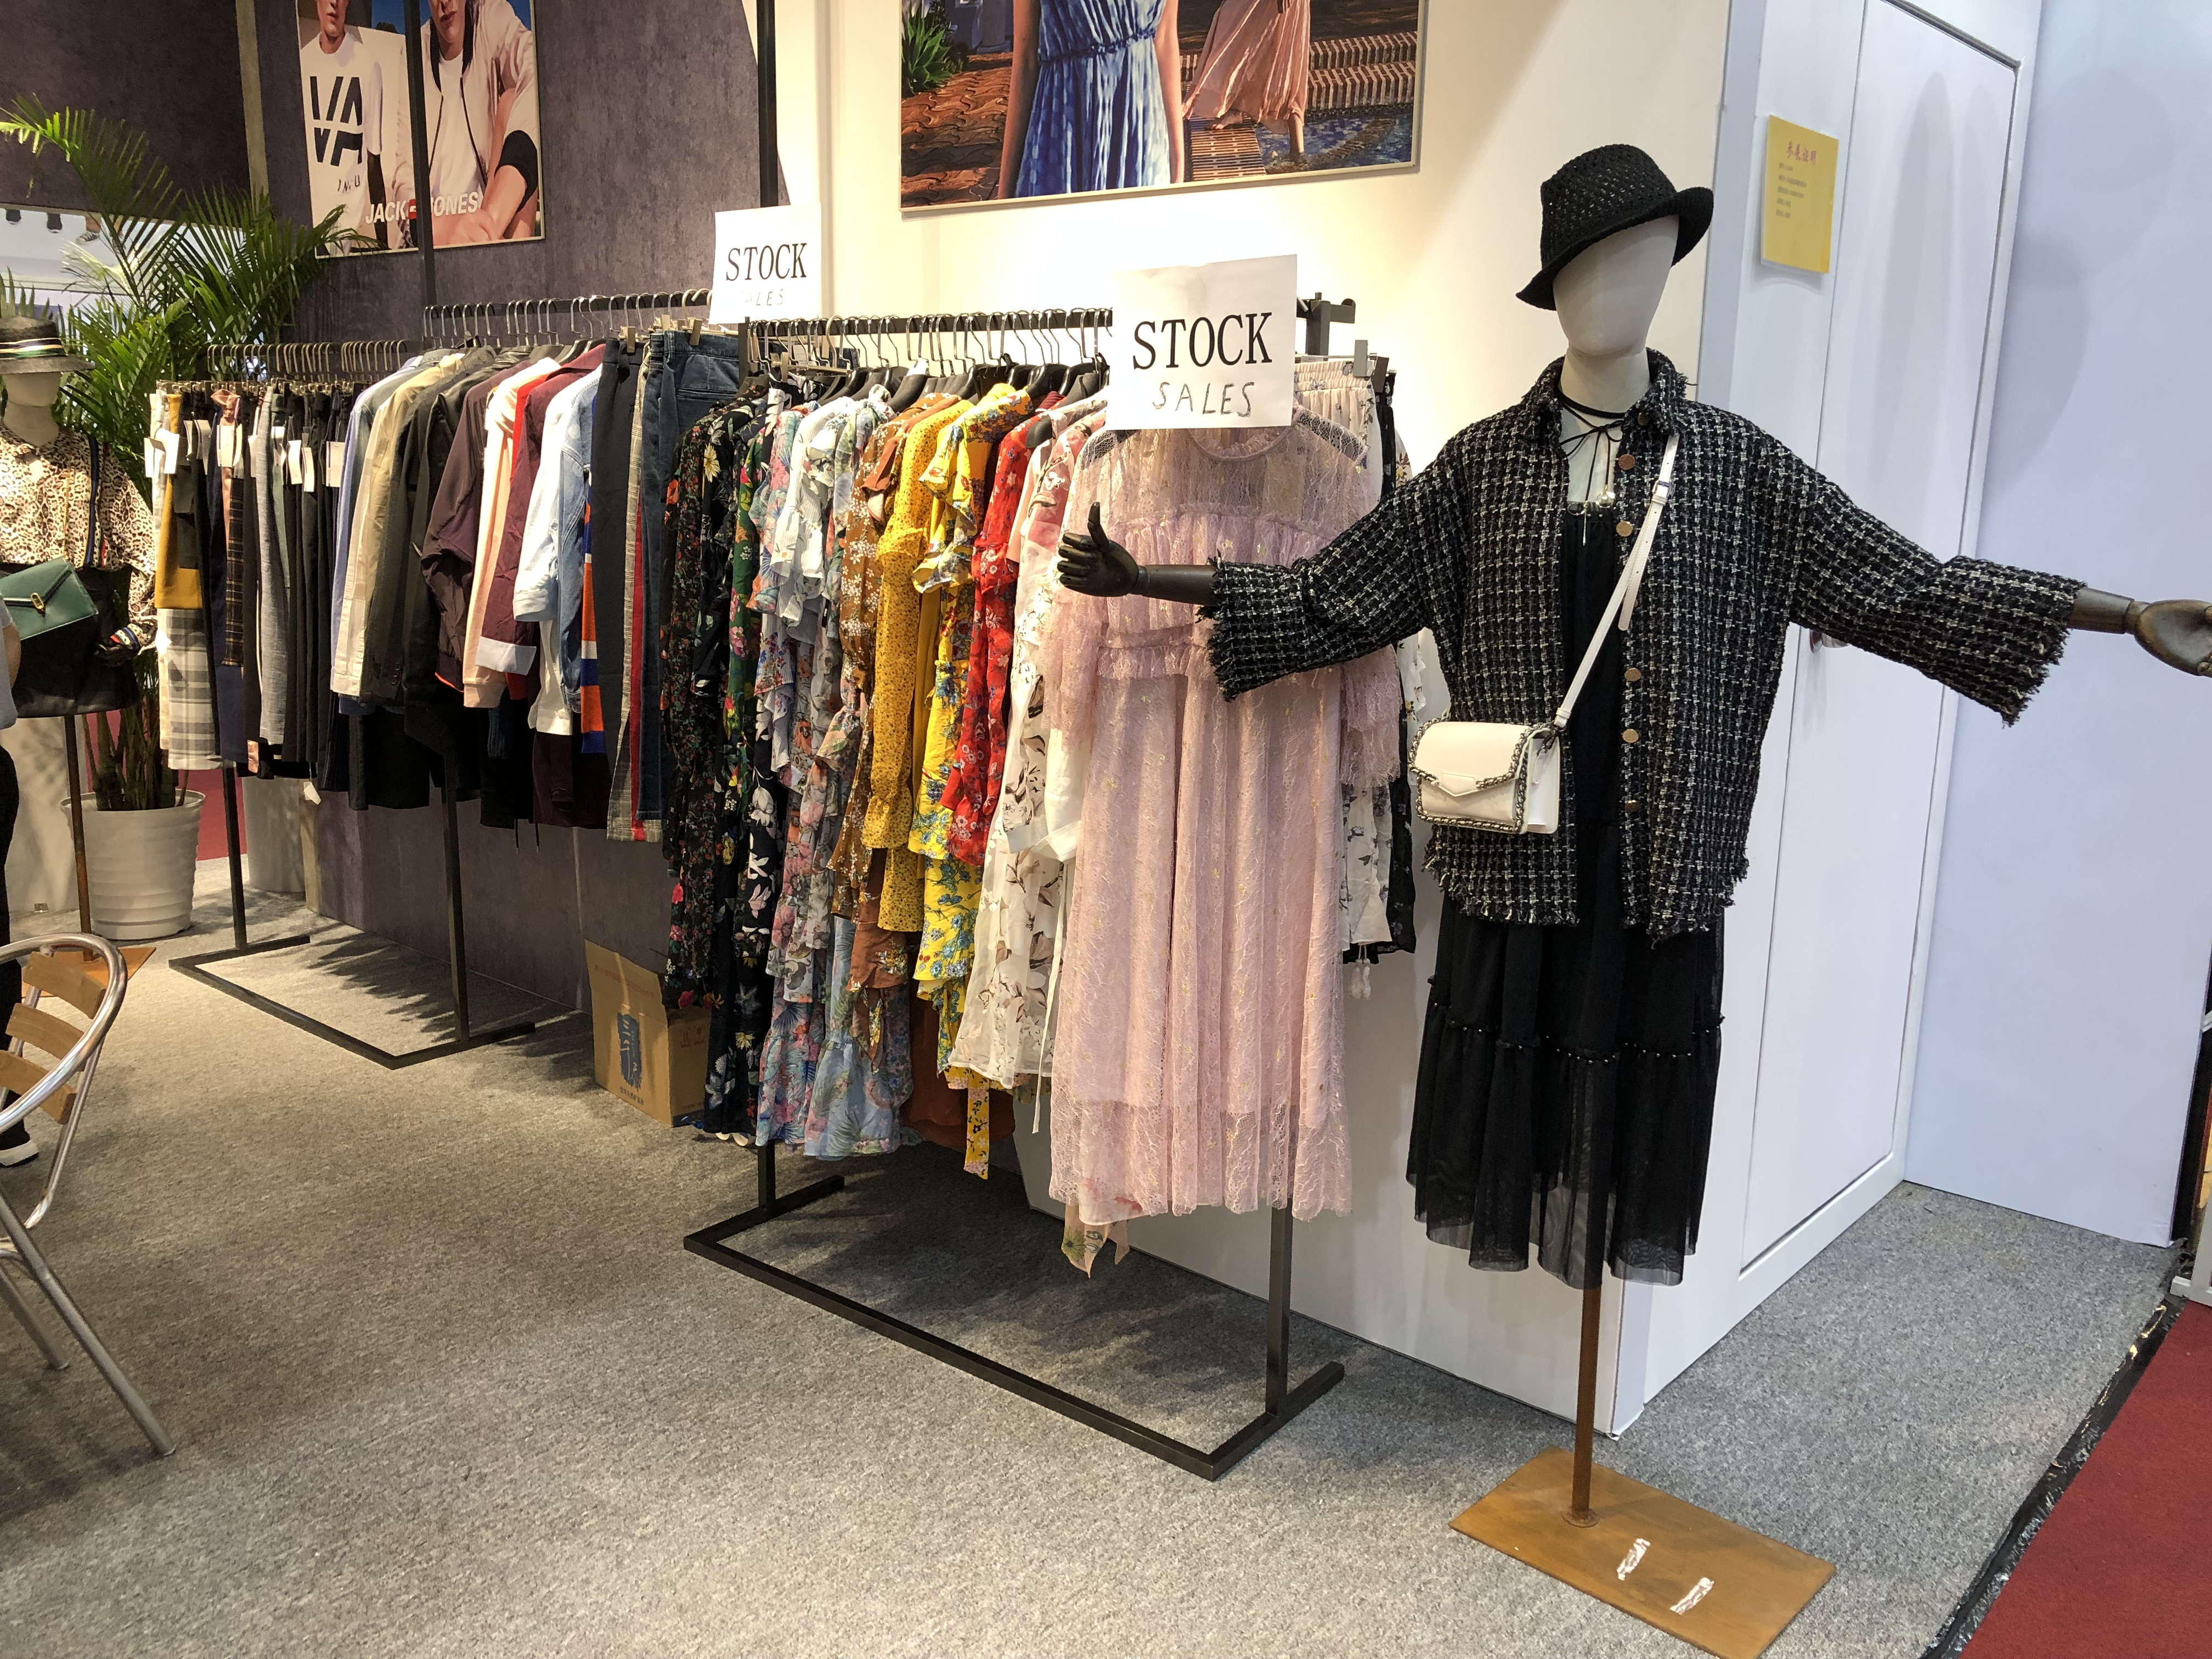
The same Lacoste Polo shirt — "authentic product from brand direct procurement" and "OEM factory surplus" have drastically different pricing power. The former can enter brand specialty store full-price sales channels openly, while the latter can only circulate in discount stores and live-streaming surplus channels. The difference in channel sources determines the product's "legal identity" and "commercial fate" — a shackle that any standardized SKU label cannot capture.

Second Dimension: Coupling of Time and Condition.

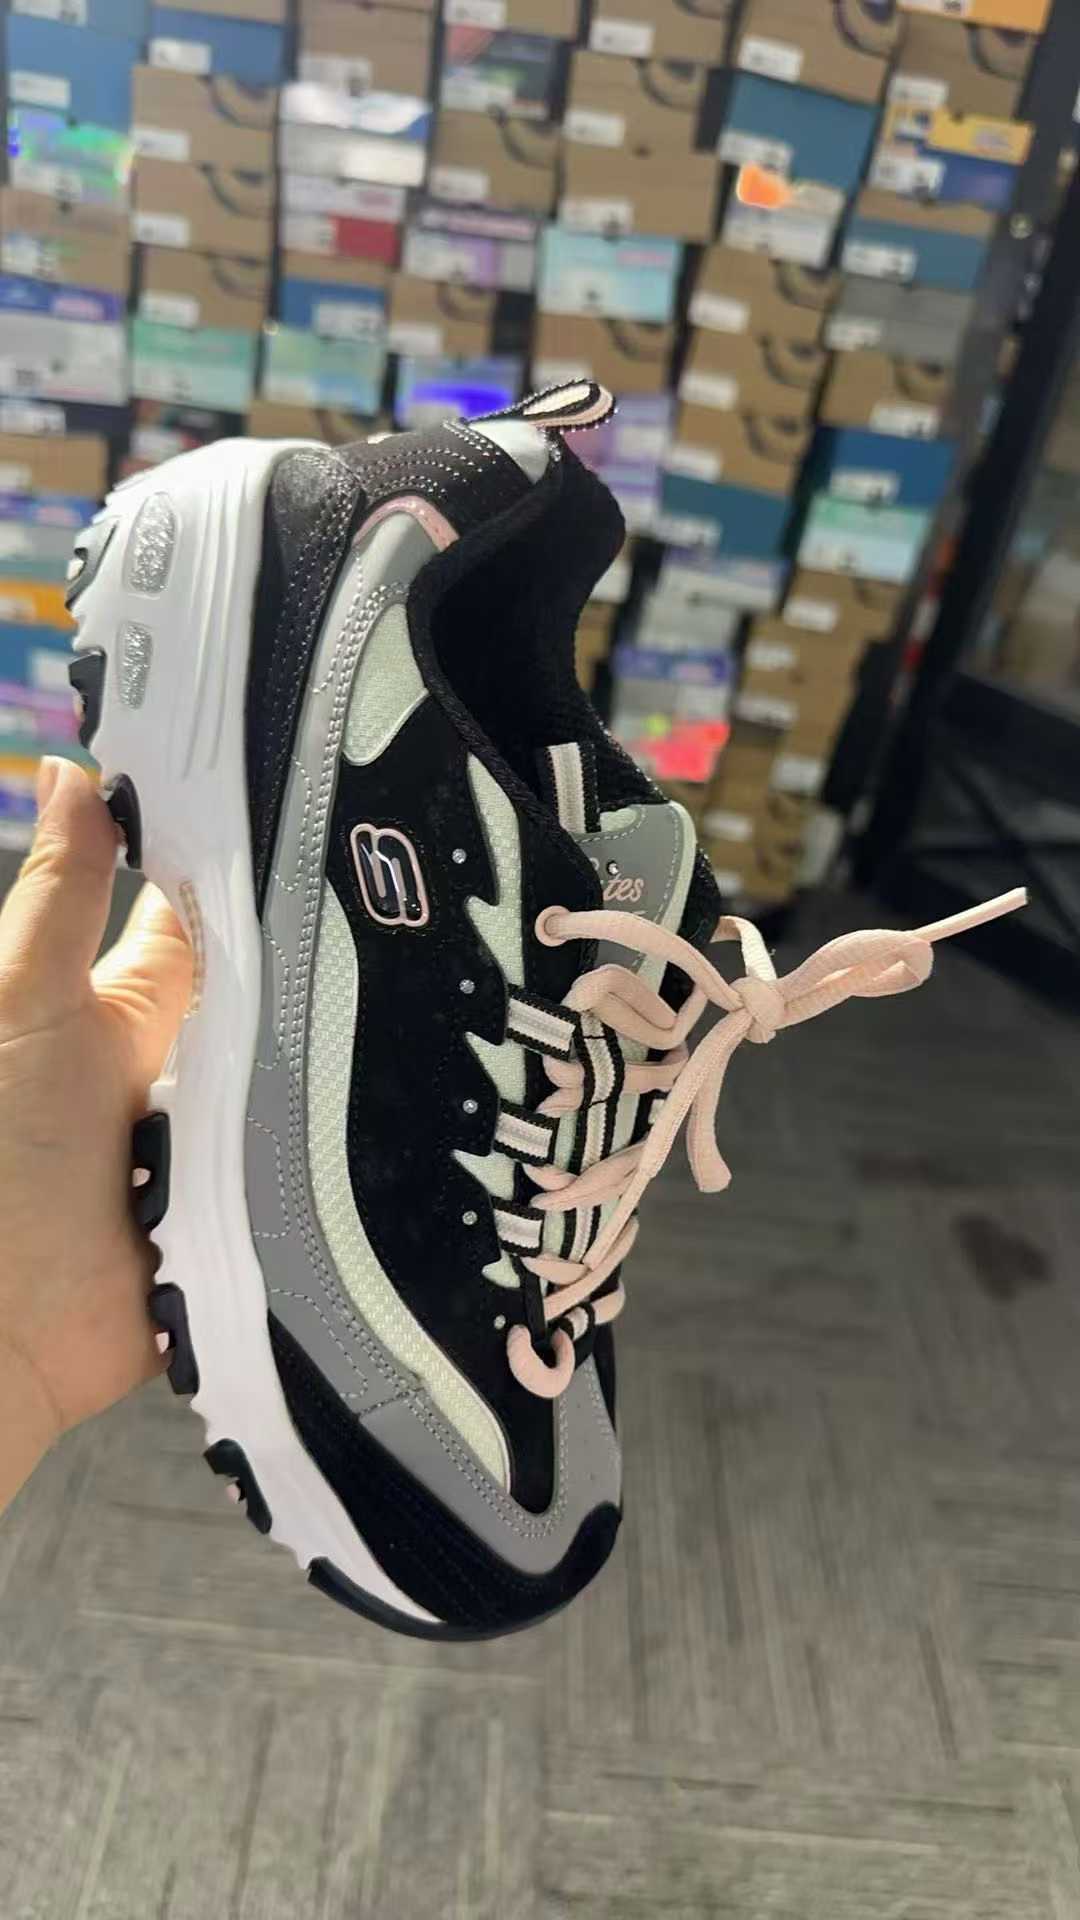
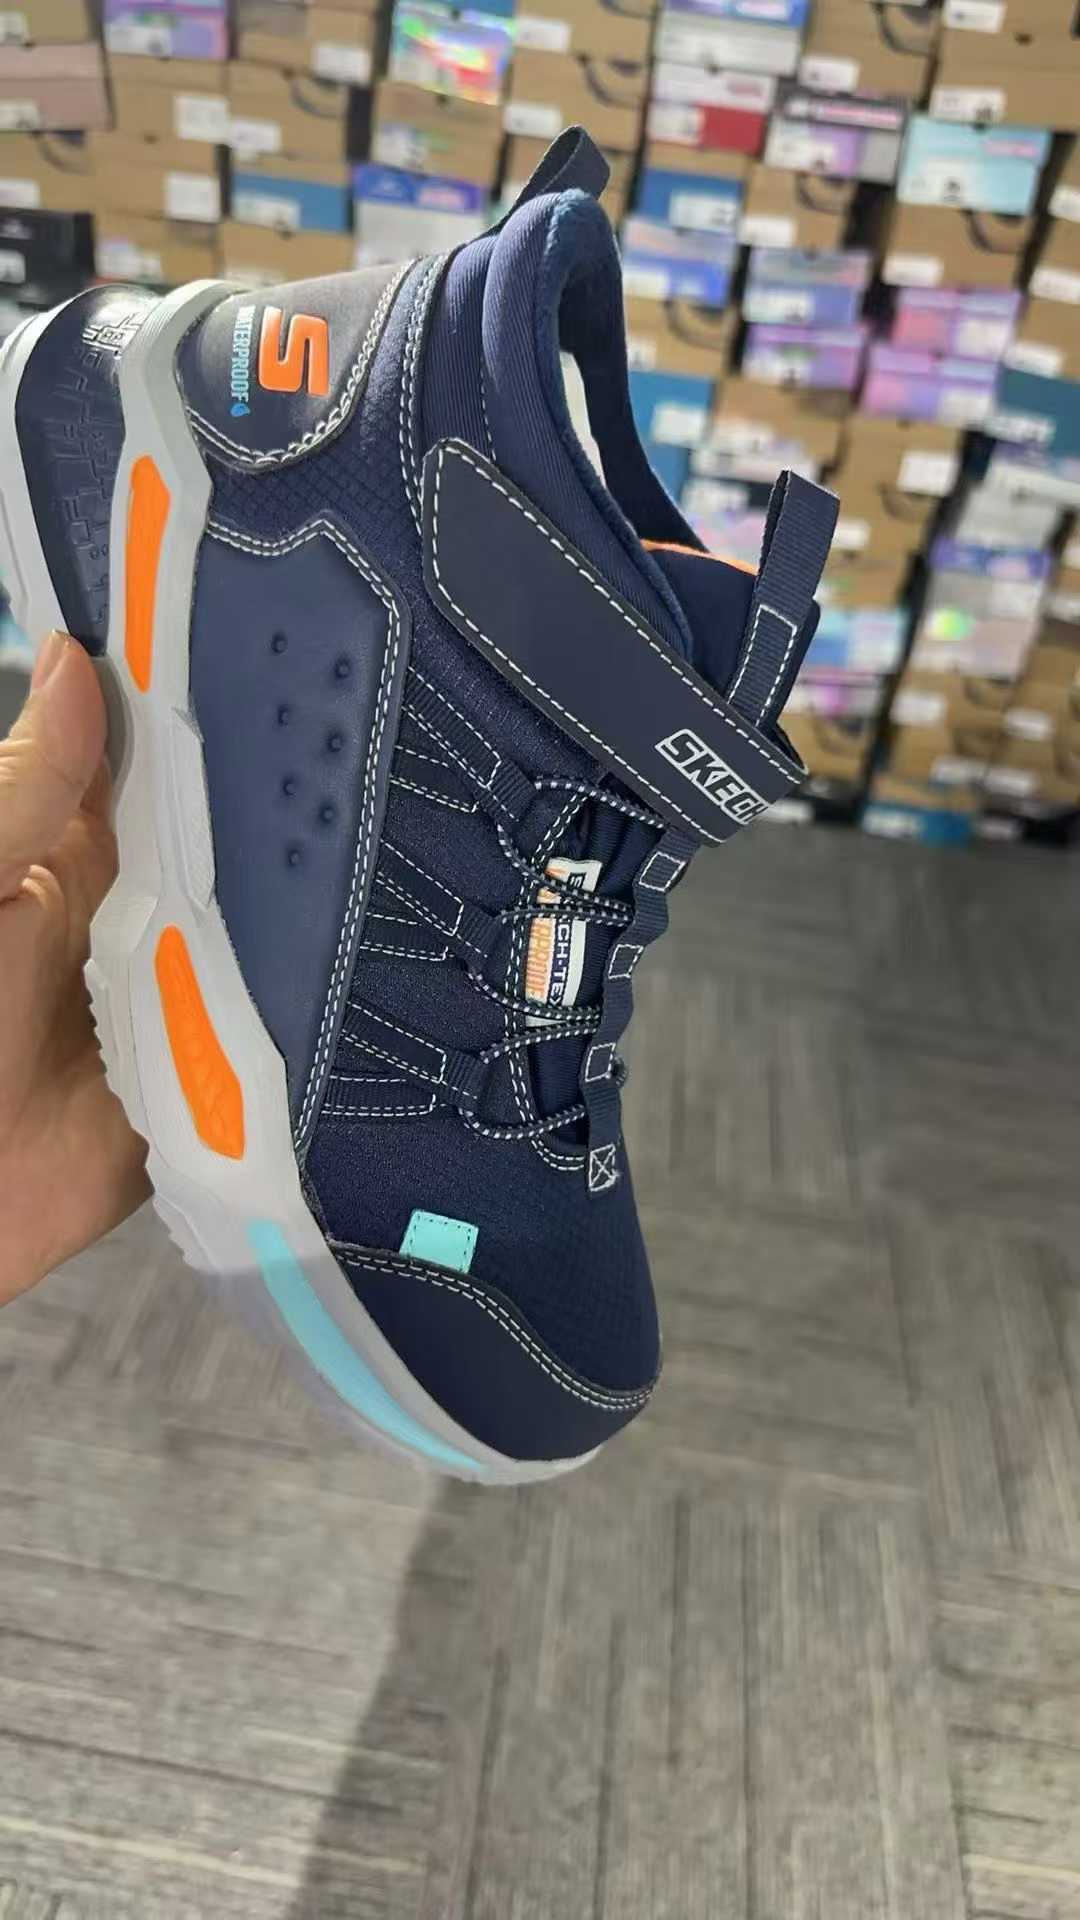
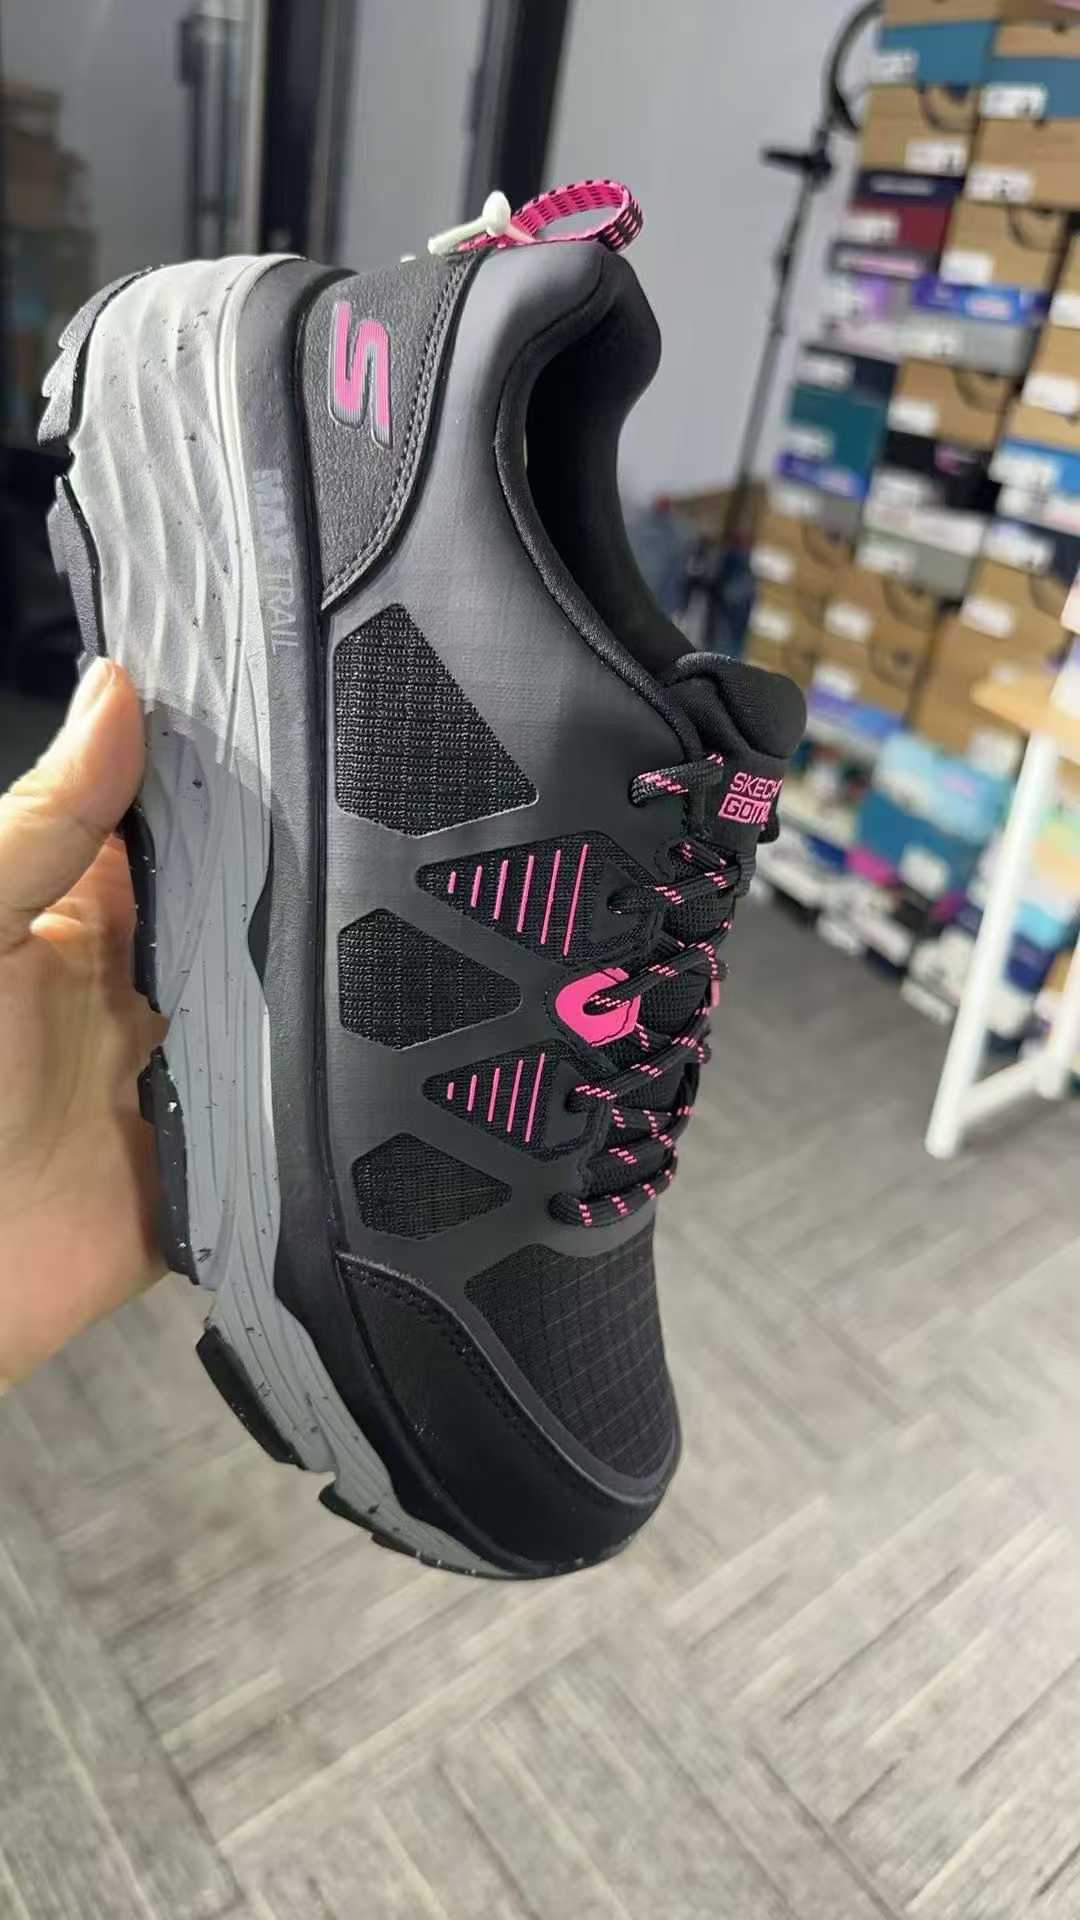
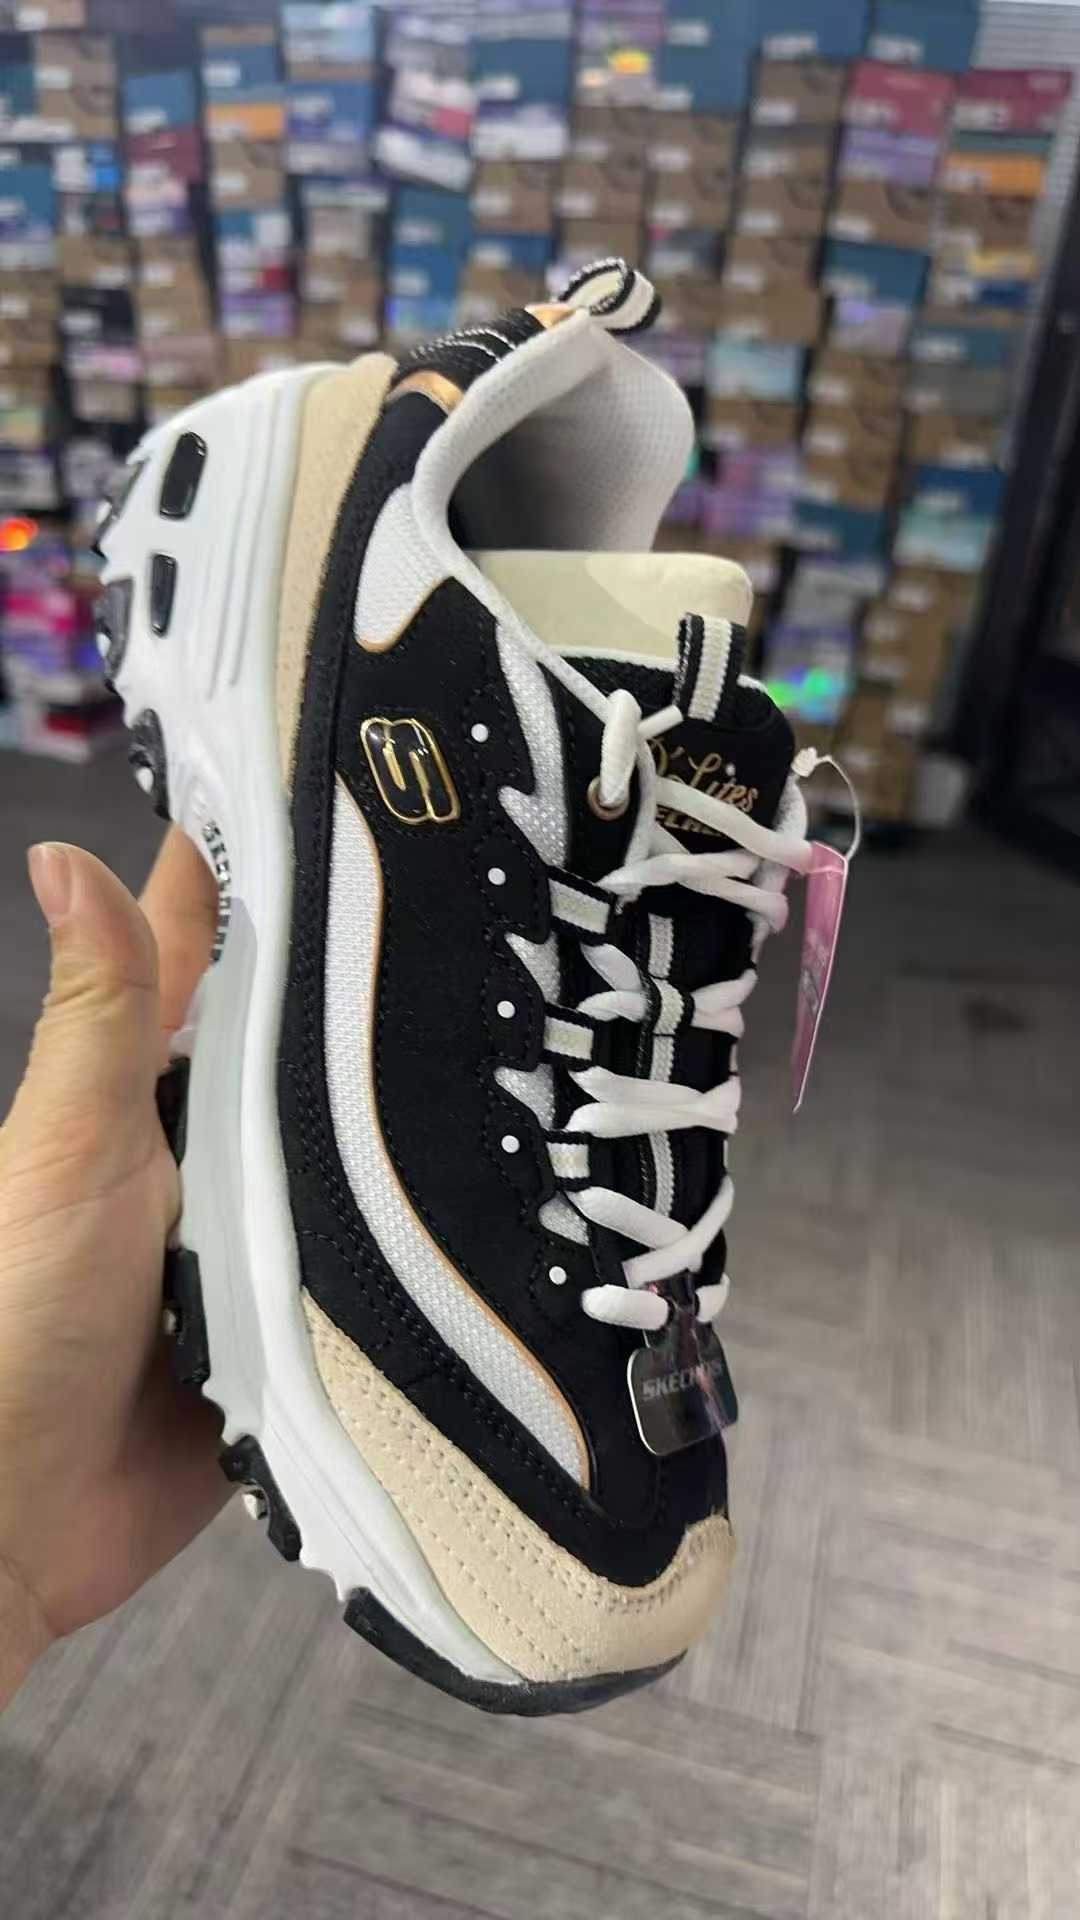
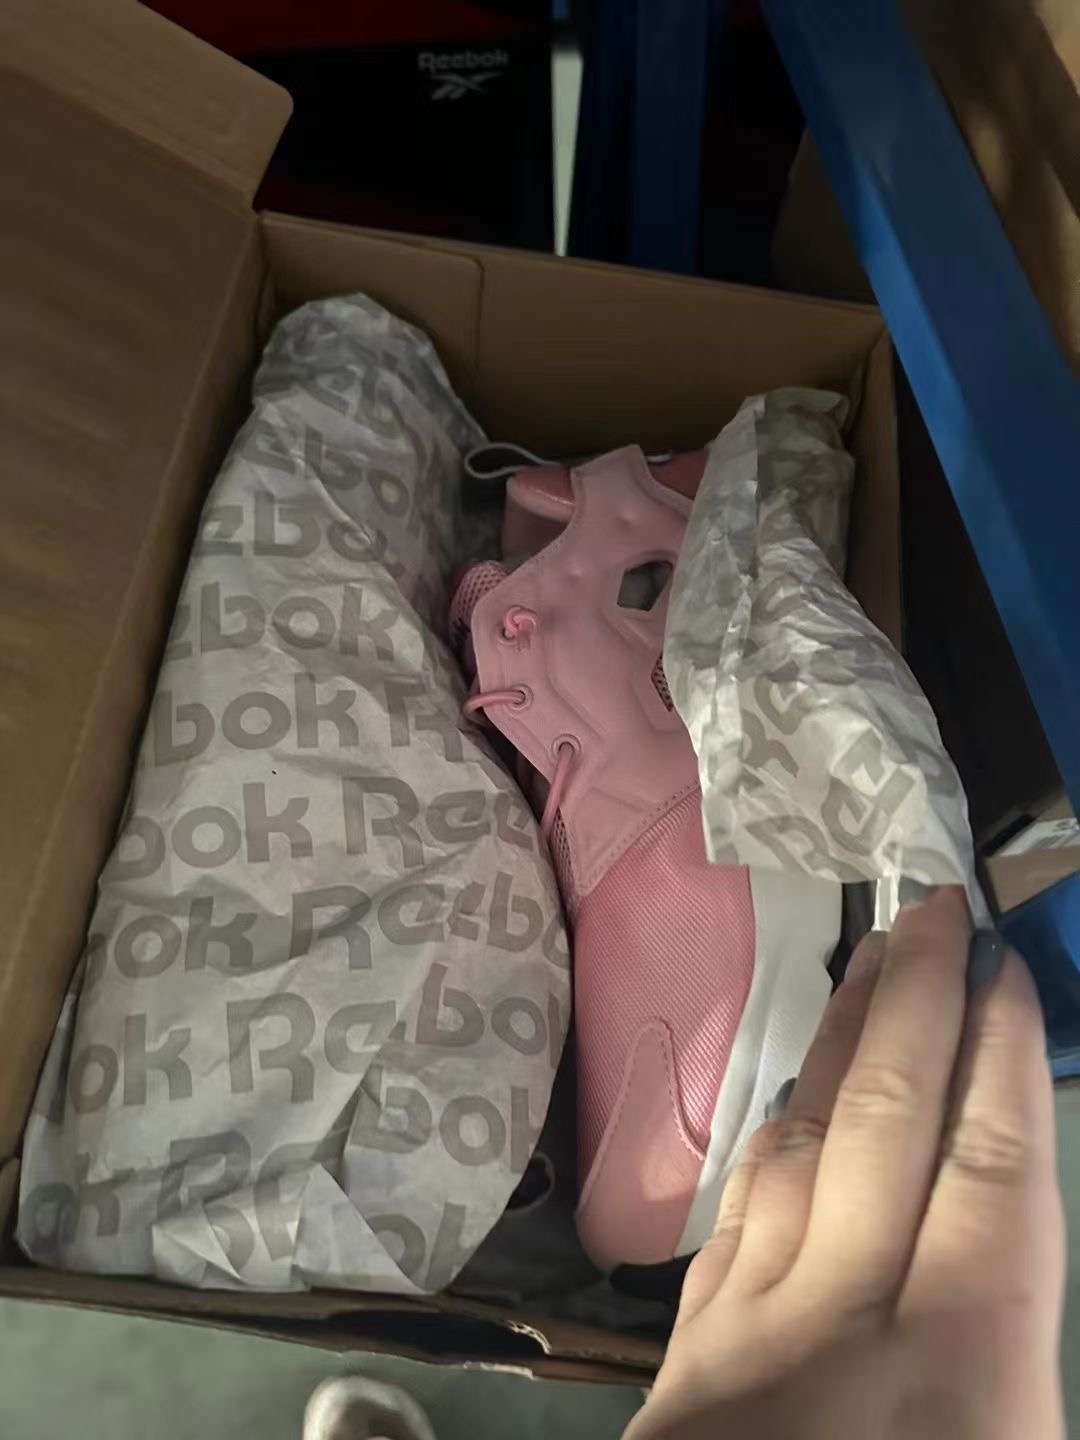
Inventory has a "shelf life." Here, "shelf life" is not a food safety concept, but a dual constraint of fashion lifecycle and capital turnover pressure — sportswear from one season ago and three seasons ago, even from the same brand, may have market values differing by 50% or more. Similarly, a pair of Skechers sneakers, brand new with hang tags versus "defective products" with tags removed but unopened packaging, receive drastically different treatment in the wholesale market. Time has turned each batch of inventory into a unique "time capsule," and the speed and direction of its value decay are specific.

Third Dimension: Uniqueness of Size and Ratio Distribution.

Inventory of branded apparel has never been "evenly distributed." A complete SKU matrix may have 180 SKUs (6 styles × 6 colors × 5 sizes), but brand returns are often "size-picked" — certain sizes are out of stock, certain sizes are overstocked. This specific size incompleteness turns each batch of inventory into a "unique puzzle piece," and buyers need to match specific inventory ratios according to their channel characteristics (Northern markets prefer XL/XXL, Southern markets prefer M/L).

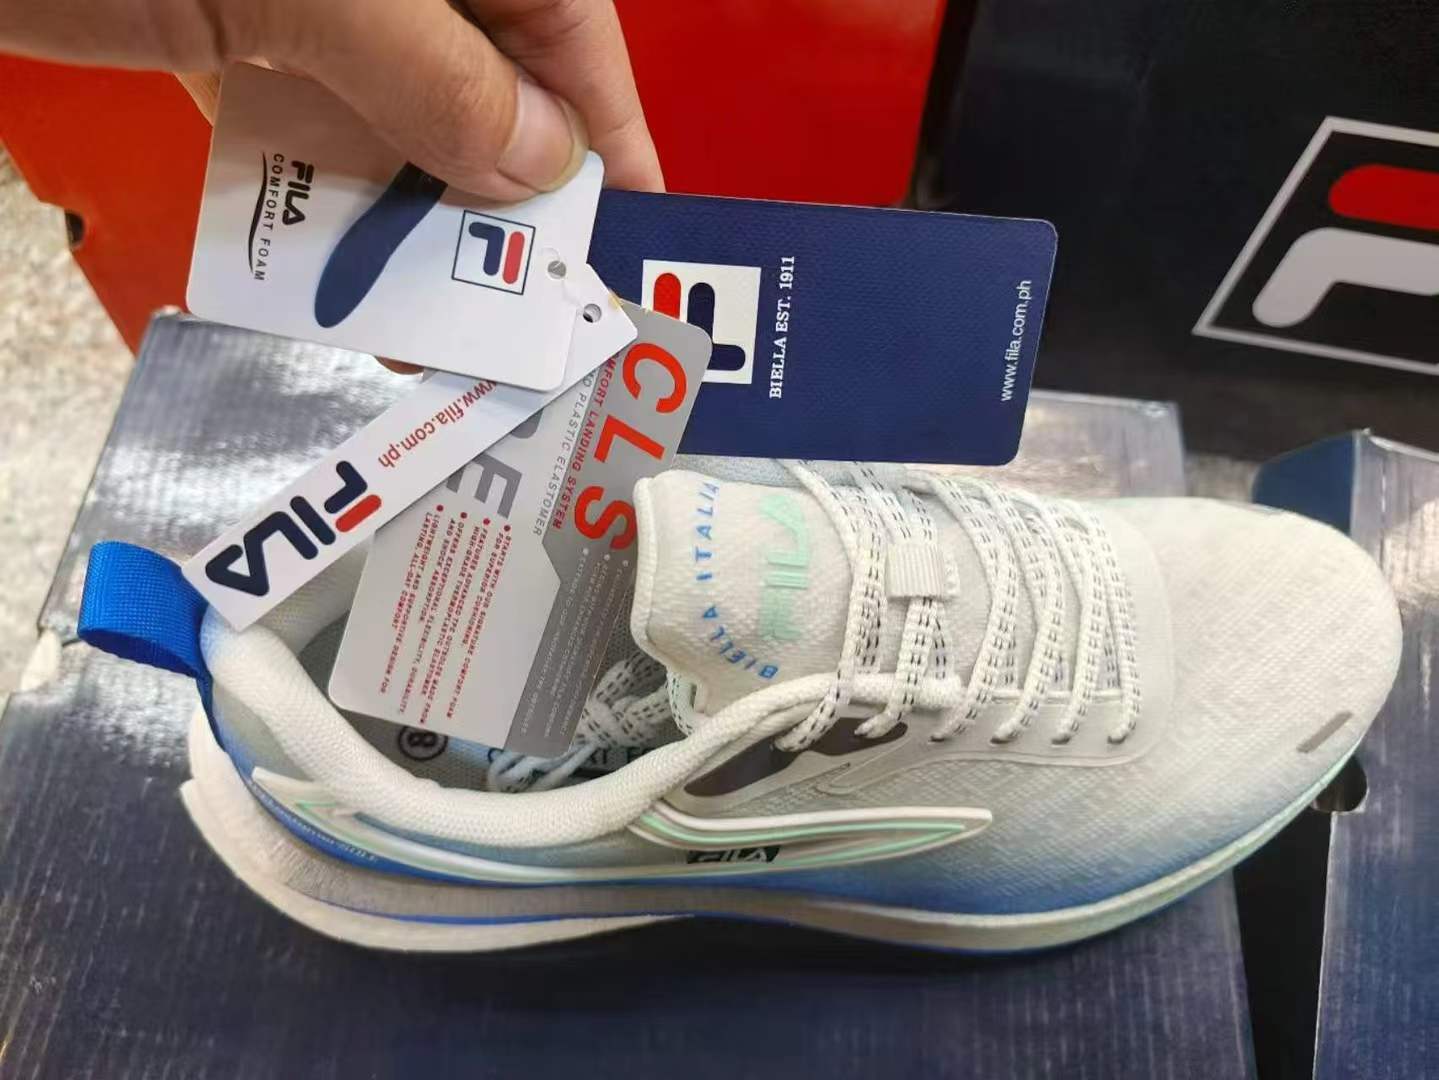
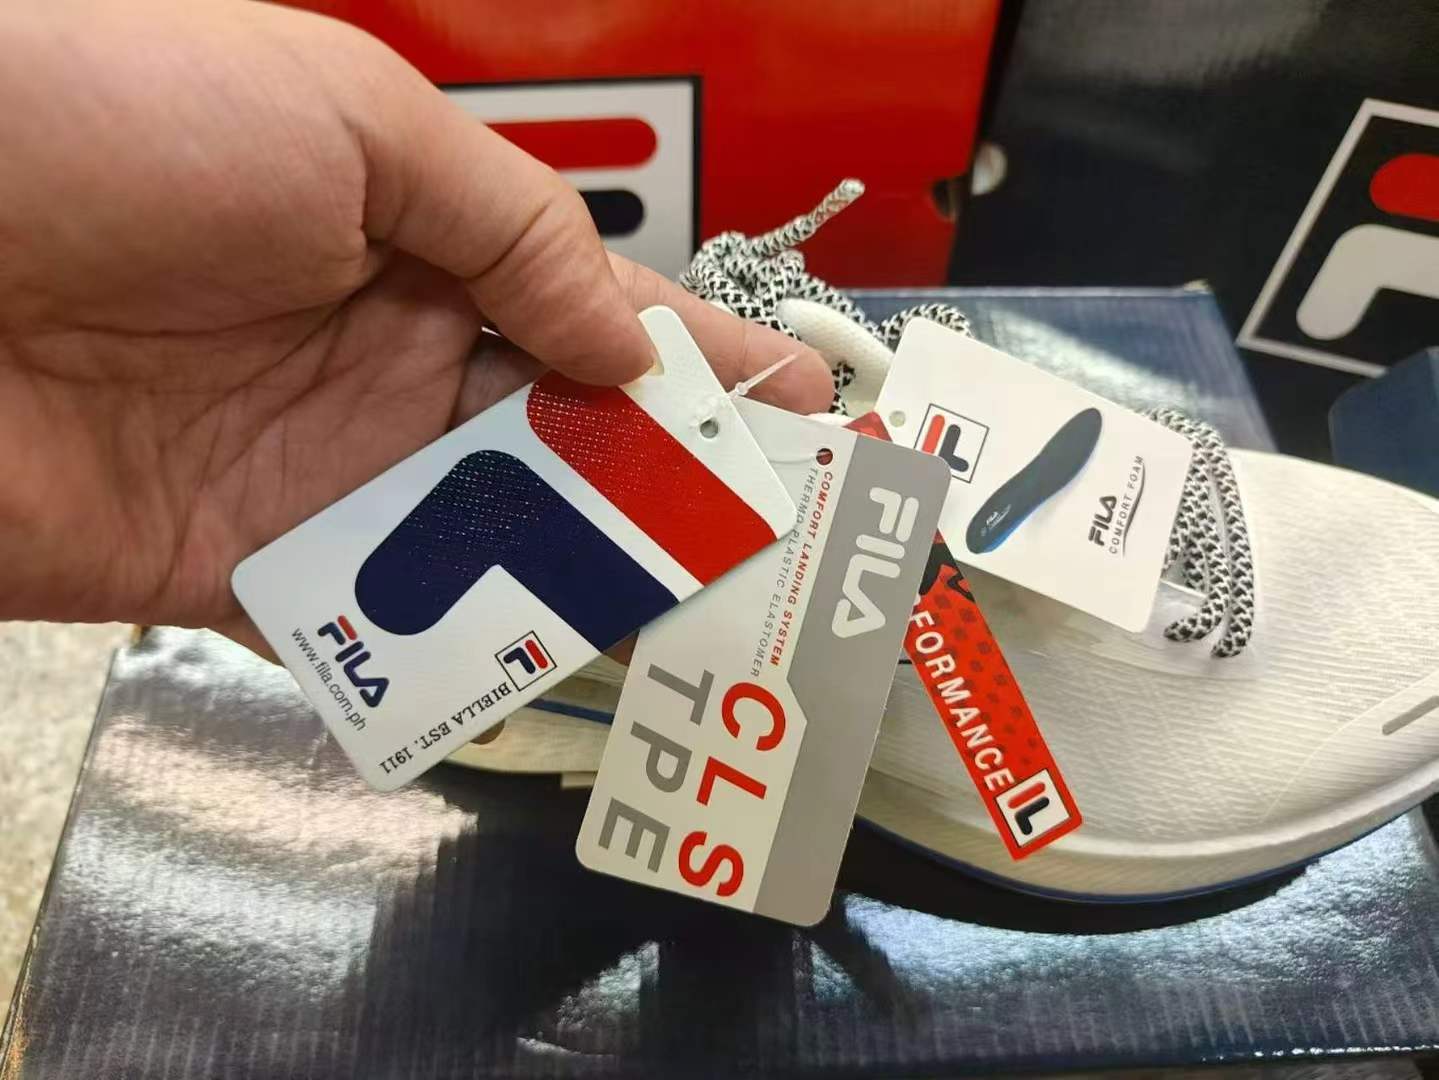
Fourth Dimension: Ambiguity of Condition and Originality.

The gap between "authentic products" and "authentic products" may be larger than the gap between authentic products and counterfeit products. A Lacoste item "brand new with original packaging and hang tags" and a Lacoste item "without hang tags but guaranteed authentic" may have a wholesale market price difference of 30%-50%. Minor differences in condition (whether there is color difference, whether there are slight stains, whether tags have been cut) constitute a continuous spectrum, rather than a simple binary classification.

1.3 Commercial Implications of Non-Standardness

This four-dimensional non-standardness brings a profound commercial implication: In inventory trading, there is no concept of "the same batch of goods."

Two wholesalers both claim to have "5,000 Lacoste Polo shirts" in hand, but if any one of the channel source, production batch, size distribution, and condition status of these 5,000 items differs, they are completely different commodities. This is why the words "in stock" have extremely limited meaning in inventory trading — the real question is: What kind of "stock"? What kind of "goods"?

This leads to the core insight of this report: when products themselves are non-standard, non-price-comparable, and highly information-asymmetric, then the ability to capture, interpret, and transmit information naturally becomes the source of competitive advantage, even the core source.

Chapter 2: Why "Information Resources" Far Outweigh "Inventory"

2.1 The Value Chain of Inventory Information

Let us break down the generic concept of "information" into the types of information that truly create value in inventory trading. According to our industry observations, the following five categories of information constitute the core pyramid of inventory information value:

The Pinnacle: Predictive Information on Supply-Demand Mismatch.

This is the top layer of the information pyramid and the most scarce type of value. Specifically, it is predicting "when and in what manner a certain brand's certain batch of goods will flow into the market." This type of information requires establishing deep information channels with the brand's procurement department, OEM factory management, and even third-party service providers cleaning up inventory. A classic case: in Q3 2025, a certain international sports brand's China region inventory cleaning agency launched a "global tag-removal plan" three months in advance. The secondary wholesaler who obtained this information first had already locked in the optimal supply channel two weeks before the goods officially entered the market. When the floodgates officially opened, the highest-quality ratio allocation had already been "intercepted."

The Tower: Intelligence Information on Channels and Pricing.

That is, knowing "which channel this batch of goods is currently listed on," "where the seller's bottom-line psychological price is," and "what the recent market transaction price is for goods of the same quality." This type of information requires continuous market monitoring and mutual exchange within peer networks. Taking Skechers sneakers as an example, the same batch of "Grade F" (minor defects) inventory, if it is surplus from a Dongguan OEM factory, may be called at $8 in Guangzhou Shijing wholesale; if it is returned goods from brand direct procurement, the wholesale call price in Puning area may be $6. The same goods, different channel sources lead to price differences up to 30% — and this "channel intelligence" is something that any static inventory list cannot provide.

The Waist: Identification Information on Condition and Authenticity.

That is, knowing "what the actual condition of this batch of goods is," "whether counterfeit goods are mixed in," and "where the identification difficulties lie." In the inventory market, the credibility of the word "authentic" is far less reliable than the combination of factory orders, original factory shipment certificates, and brand authorization documents. Mastering condition identification capabilities and supply chain traceability capabilities can allow a wholesaler to stand out in homogeneous competition.

The Base: Basic Inventory Information.

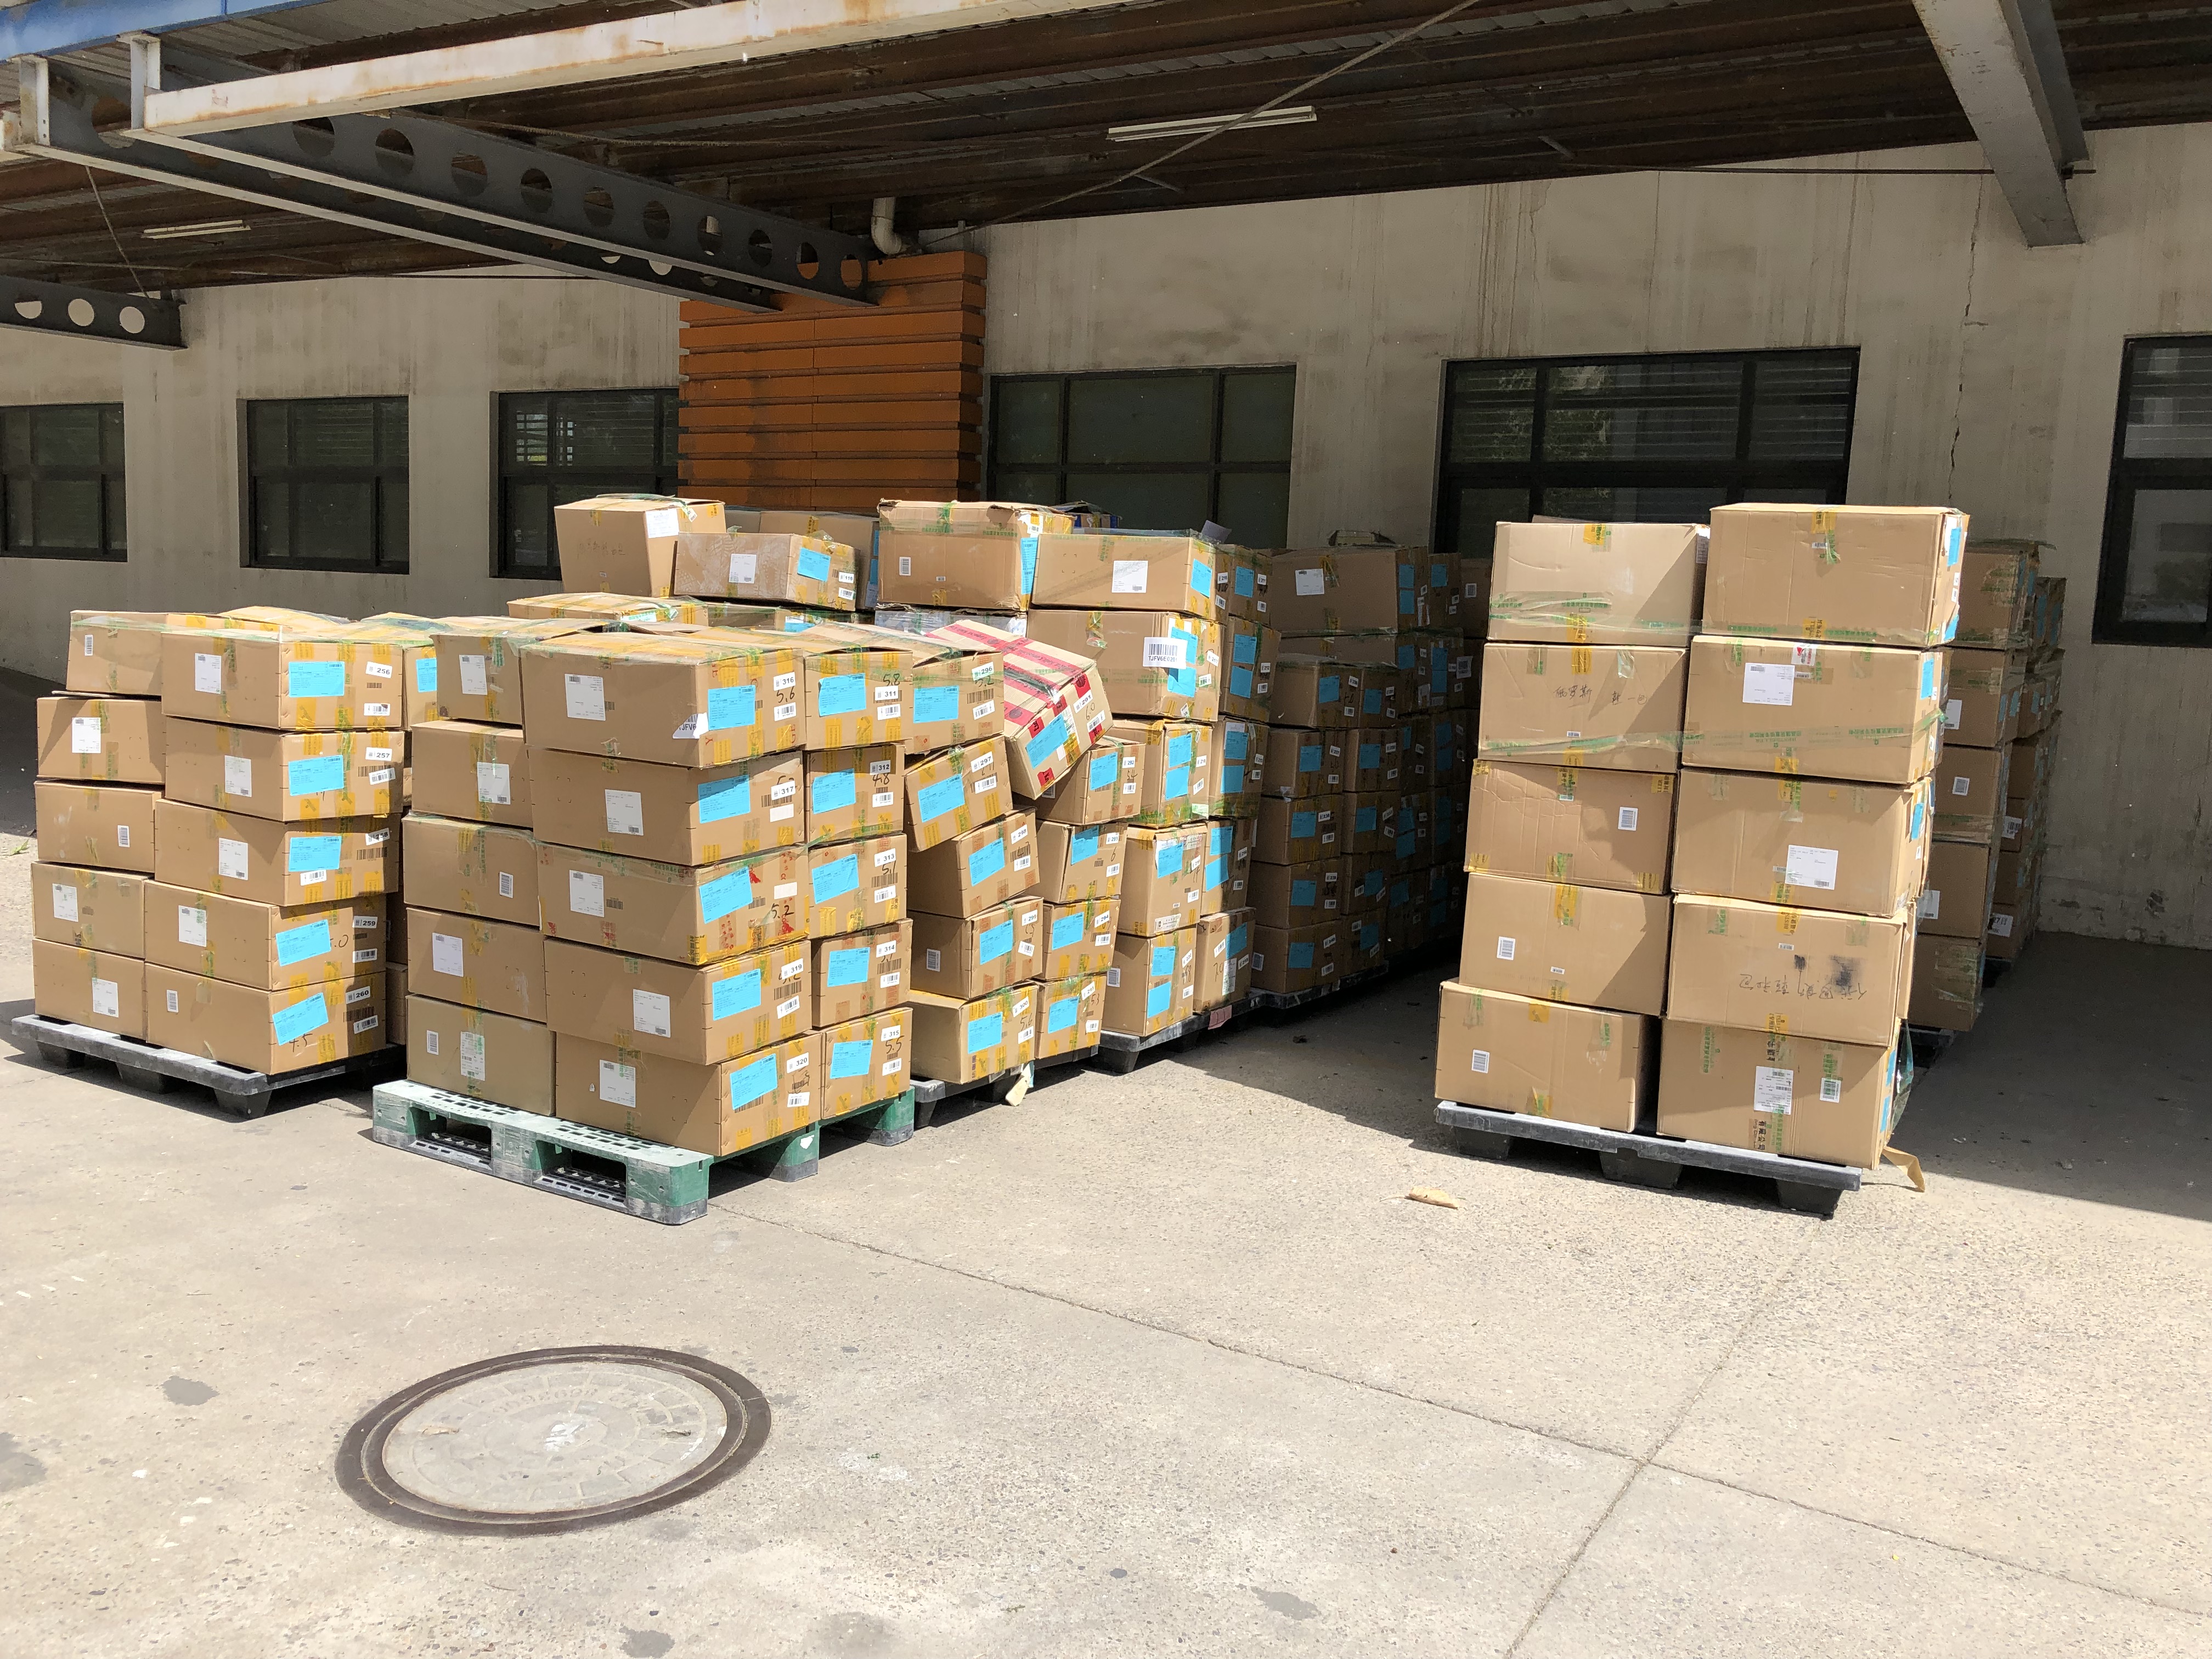
That is, knowing "what goods are available in a certain wholesale market today" and "how much inventory a certain supplier has in hand." This is the most basic and most easily replicated layer among all information — essentially, it is just a digital relocation of "shelf display," with limited value.

2.2 Why Information Is Valuable: From an Economic Perspective

Starting from basic economic principles, we can understand why information can create excess value in inventory trading:

First, the marginal cost of information approaches zero.

Once a hot inventory information is captured by you, you can sell it to 10 customers at the same time without depleting the value of this information itself. This forms a sharp contrast with the "one goods, one sale" (once sold, gone) of physical inventory. An intermediary who masters exclusive supply-demand intelligence can use the same information to simultaneously serve multiple buyers and sellers, collecting commissions or price differences from them — this is pure "mental arbitrage."

Second, information can alleviate market uncertainty.

The biggest pain point of inventory trading is "uncertainty": uncertainty about whether this batch of goods is authentic, uncertainty about how much market price can hold, uncertainty about where the next buyer is. The essence of paid information is "purchasing certainty" — customers are willing to pay a premium for the hidden insurance of "reducing the probability of stepping on pitfalls." The intermediary providing this certainty is actually operating an "information insurance company."

Third, information can break the "Lemon Market" dilemma.

George Akerlof revealed a truth in his classic 1970 paper "The Market for Lemons": when buyers and sellers have extremely asymmetric information, high-quality goods will be squeezed out of the market by low-quality goods. The inventory market is exactly such a "lemon market" — because it is impossible to identify condition and authenticity, buyers tend to suppress quotes or simply stop trading. And an intermediary mastering reliable identification information is itself repairing the information asymmetry in the market, allowing suppressed trading demand to be released — this itself is value creation.

2.3 A Thought Experiment: What If There Is No Inventory, Only Information

Let us do an extreme thought experiment: assume you are an "zero-inventory" intermediary, and you only have one thing in hand — an inventory information retrieval system covering the entire industry. This system can tell you:

  • Within the past 72 hours, what new goods have been added to major inventory wholesale markets nationwide
  • Brand, category, quantity, quote, and seller contact information of these goods
  • The transaction price range of similar goods in the past month
  • Which goods are "hot items" (repeatedly inquired within 72 hours)
  • Which goods are "stagnant items" (listed for 30 days with no takers)

With this system, what can you do?

You can be an "inventory information broker": when buyers inquire, you search the system for matching supply sources and charge 1%-3% commission from buyers; when sellers ship, you search the system for interested buyers and charge the same commission from sellers. You do not need to advance capital to hoard goods, do not need to rent warehouses, and only need to pay the system maintenance cost and labor cost.

In theory, the gross profit margin of this model can be far higher than the traditional wholesaler's "buy low, sell high" — because you are using information to "broker," not using capital to "gamble."

Of course, this thought experiment has two premises: first, you need to establish a reliable information collection and update network; second, you need to gain the trust of both buyers and sellers (this itself is the hardest "intangible asset"). But under the digital infrastructure of the 2020s, the difficulty of realizing these two premises is exponentially decreasing — social media community operations, B2B platform digital leads, and AI recommendation algorithm matching capabilities are all making the "zero inventory, asset-light" information service provider model feasible.

This is why we say: in the second half of inventory trading, the real gold mine is not in the warehouse, but in the database.

Chapter 3: Criticizing "Inventory Fetishism" — Why You Should Not Worship Wholesalers

3.1 What Is "Inventory Fetishism"

"Inventory Fetishism" is a concept we invented to describe a widely existing mindset in the inventory trading industry: the linear logic of "having inventory = having discourse power = being able to make money." The manifestations of this mindset include:

  • "I have millions of goods placed here, still afraid they won't sell?" — treating inventory as a "moat"
  • "Look at the Adidas, Nike, and Lacoste in my warehouse, which one is not a prestigious brand?" — treating brands as "hard currency"
  • "I have relationships with manufacturers, I can get this batch of goods first, do you have them?" — treating channel relationships as "core competitiveness"

These statements all have certain reason when taken individually. But when we examine them from a more macro industry perspective, we will find that they have a common blind spot — they only consider what they "have," but do not consider what the market "needs" and "who else can provide what."

3.2 The Triple Dilemma of Inventory Holders

Wholesalers holding inventory actually face three dilemmas more complex than we imagine:

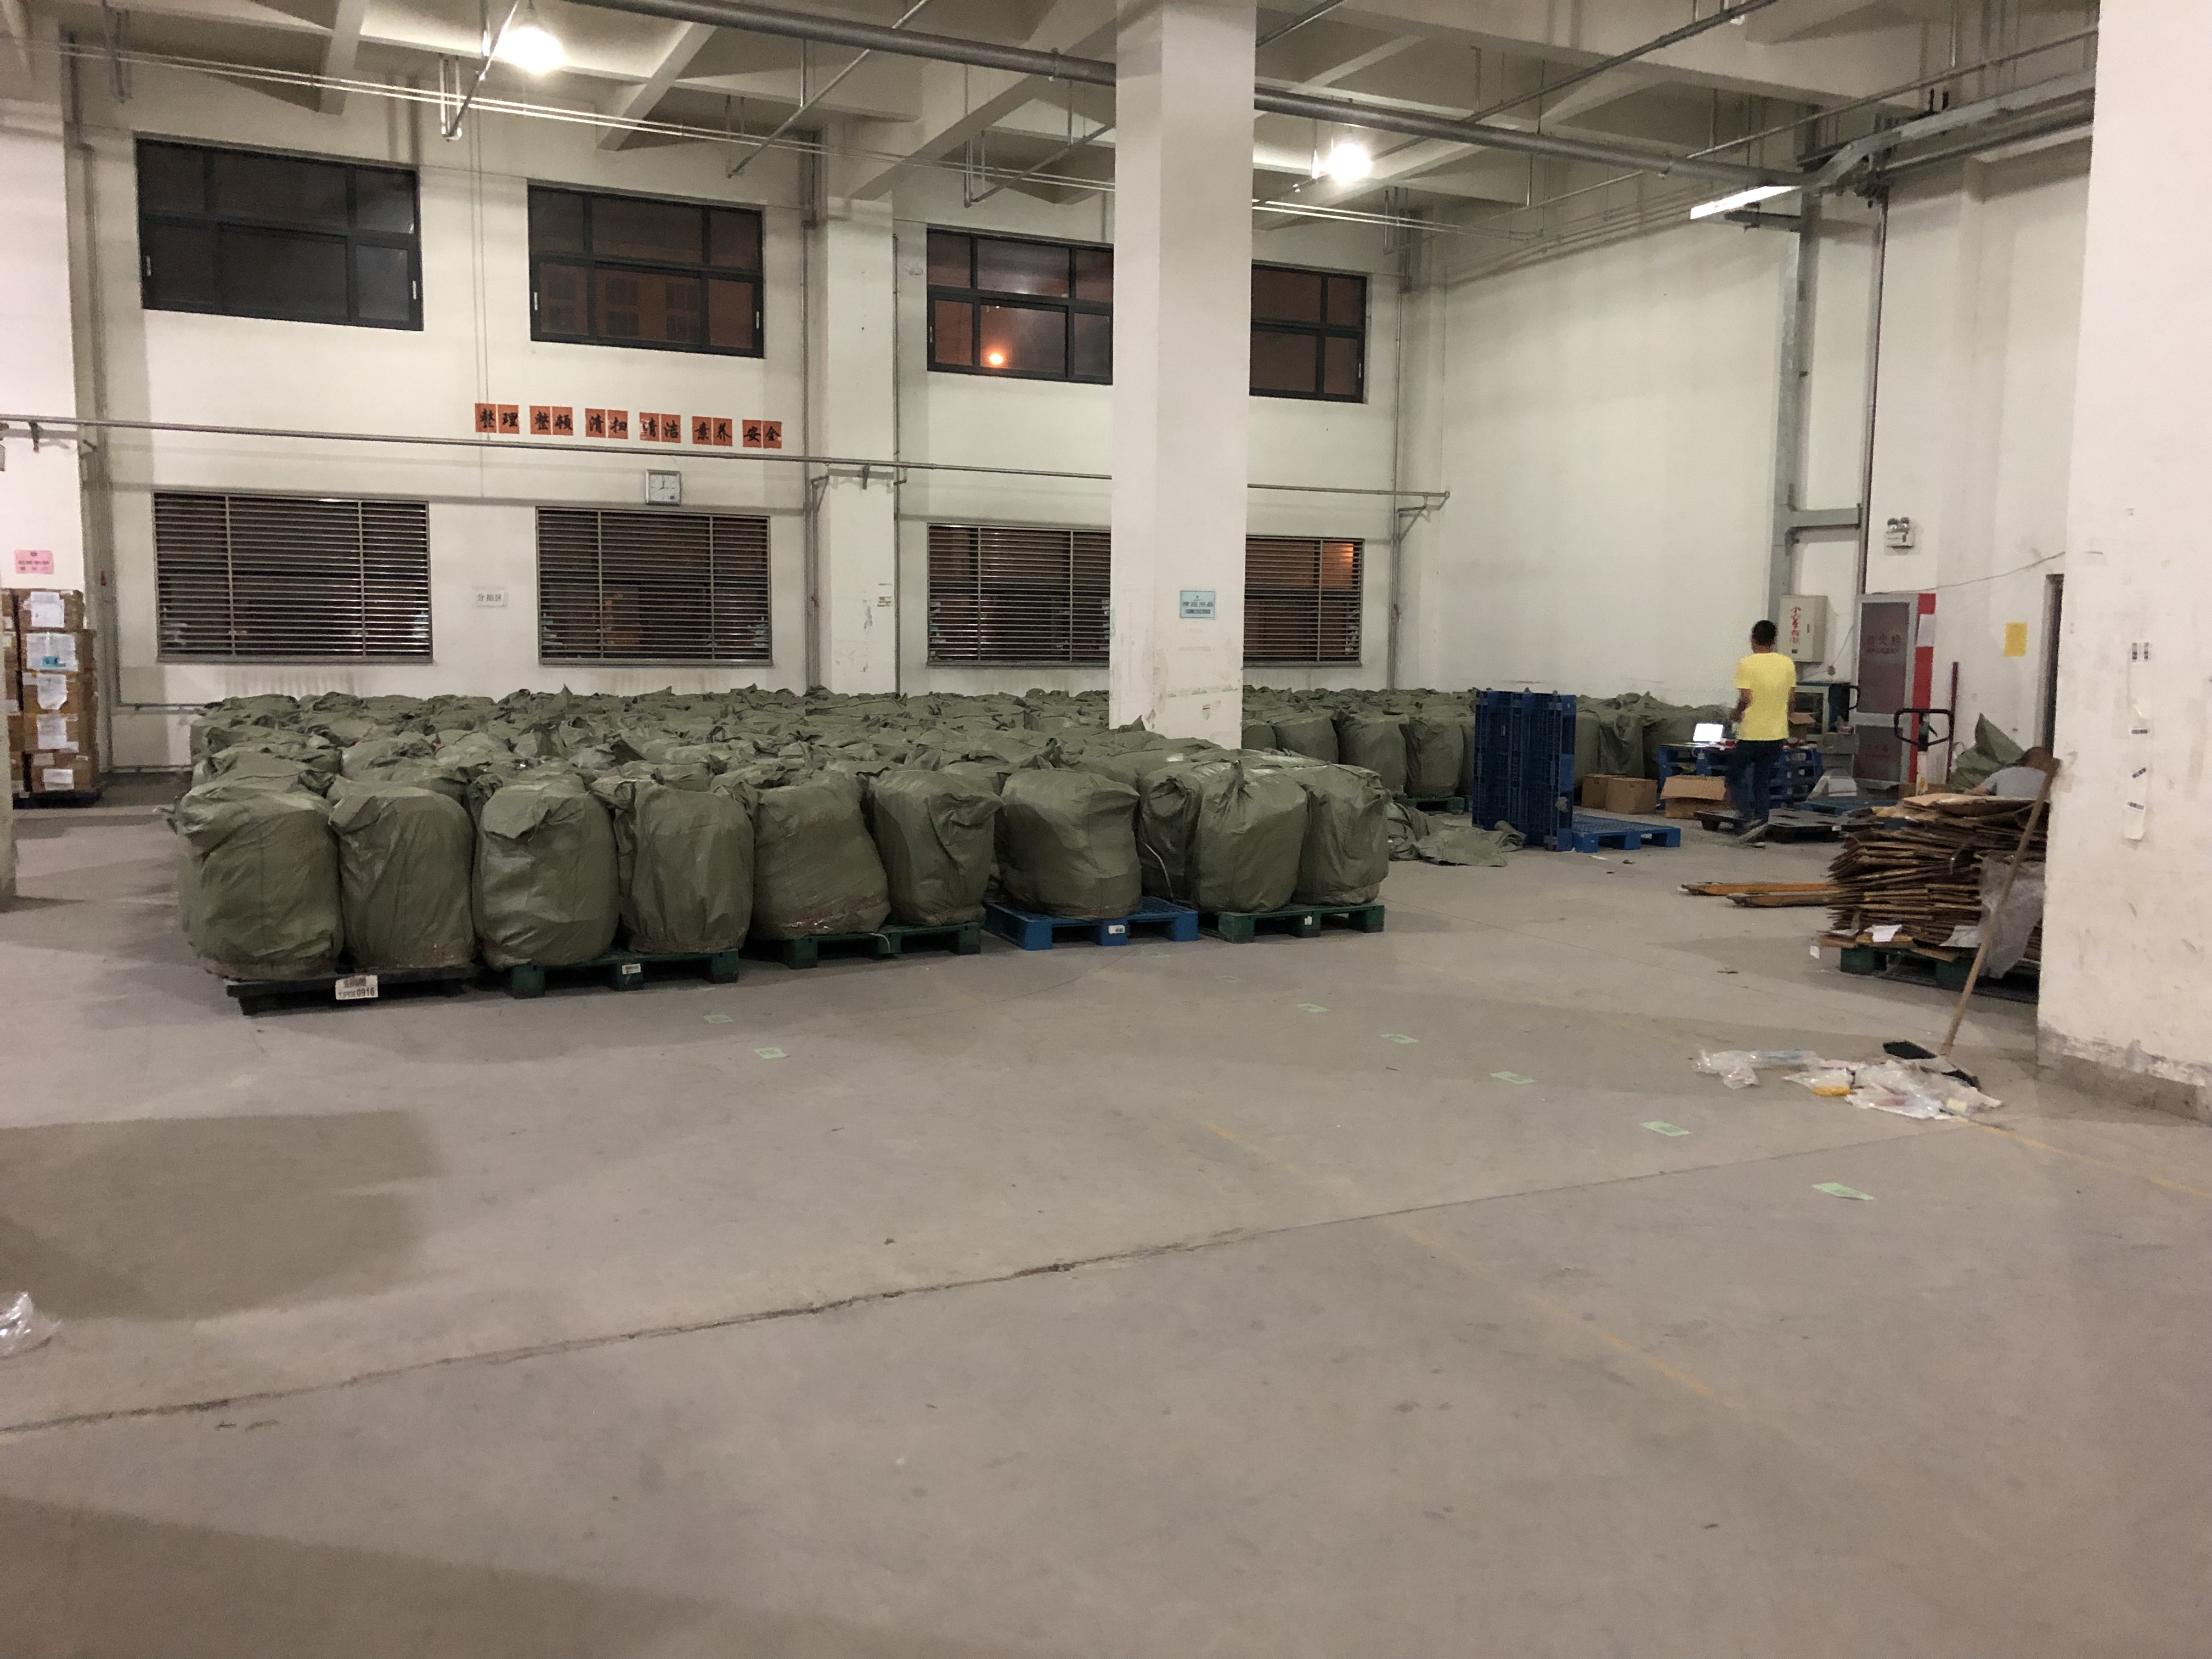
First Dilemma: Capital Lockup.

A 5-million-yuan inventory occupies 5 million yuan of working capital. Even if this batch of goods turns over once a year, ROC (Return on Capital) is only about 10%. But if the same 5 million yuan is used for information operations — such as purchasing ERP systems, building community networks, and investing in intelligence collection — theoretically, it can provide services for unlimited "virtual inventory" at the same time, with marginal cost approaching zero.

Of course, there is an important caveat here: we are not saying "wholesalers should not hold any inventory." What we are pointing out is: the way capital is used is a continuous spectrum, and pure no-inventory models and pure heavy-inventory models are at the two ends of this spectrum, and the optimal choice is often at a certain position in the middle — depending on your confidence level in information operation capabilities.

Second Dilemma: Price Pressure.

Holding inventory means bearing the "price decline risk." In the inventory market, oversupply is the norm — when there are sufficient similar goods in the market, the discourse power of price shifts from "supply side" to "demand side." A wholesaler holding 20,000 pieces of a certain brand's sportswear, if unable to find suitable buyers within three months, will face a difficult choice: either continue to press inventory waiting for the next buyer (bearing capital cost), or sell at a discount (bearing losses).

Intermediaries who master information can choose to "only be brokers, not hold inventory" — they guide buyers and sellers to complete transactions, collect commissions, and do not need to bear the risk of inventory price fluctuations at all.

Third Dilemma: Lagging Inventory Information.

The most ironic thing is that many wholesalers holding large amounts of inventory actually do not really understand the goods in their hands. They know they have "5,000 Lacoste POLO shirts," but they do not know: what is the production batch of these 5,000 pieces, what is the proportion of this batch in the brand's original SKU matrix, how much additional "secondary packaging" cost is needed if this batch of goods is to be sold in e-commerce channels, and how many similar goods are competing in the market during the same period.

Real inventory information — not just "whether there are goods," but "the relative position of these goods on the time axis and space axis" — is often held in the hands of intermediaries who have deep connections with brand owners and supply chains, not those wholesalers who pile goods in warehouses.

3.3 A Real Case Comparison

To better illustrate the problem, let us use a hypothetical but typical case to compare the two models of "heavy inventory wholesaler" and "information operation intermediary":

Dimension Heavy Inventory Wholesaler (A) Information Intermediary (B)
Core Asset 5 million yuan in inventory goods 5 million real-time updated inventory leads
Revenue Source Price difference from buying and selling Commission, membership fees, information service fees
Unit Economic Model 10% ROC/round × 2 rounds/year ≈ 20%/year 2% commission × 50 orders/month × 500K/order = 6M/year (theoretical)
Core Capability Capital access + warehouse management Information collection + matching algorithm + trust endorsement
Expansion Boundary Limited by capital and warehouse capacity Limited by information and trust boundaries
Typical Pain Point Slow capital turnover, high price volatility, inventory stagnation Trust building difficult, information monetization model immature

Of course, A and B are two "ideal types," and in reality, the vast majority of players are at a certain position between the two. But the message this comparison wants to convey is: when market competition intensifies and profit margins are compressed, the marginal advantage of Model B (information operation) will be exponentially amplified, while the marginal disadvantage of Model A (heavy inventory) will also be exponentially exposed.

3.4 Not Worshipping Wholesalers, Worshipping What?

If we do not encourage "inventory fetishism," what should we direct our attention to?

The answer is: the "infrastructure construction" of information operation — specifically, investment in the following five directions:

First, establish an information collection network.

You need to know "where the goods come from." This does not mean you need to go to the factory in person, but you need to know people who have information channels in factories, brand owners, and logistics companies. Information has hierarchies — the closer to the source, the more valuable.

Second, establish digitalization capabilities.

You need to standardize and digitalize the "what the goods are" that you know. A simple example: when a buyer asks you "what goods are available," you should not send them a vague voice message, but should send them a structured Excel table — brand, category, quantity, quote, size distribution, condition status, channel path. This information looks ordinary, but in actual operation, you will find that 90% of wholesalers cannot do it — they still use WeChat voice and Excel screenshots to manage inventory.

Third, establish trust endorsement.

You need to let buyers believe "what you say is true." In an industry with information asymmetry, trust is the most scarce commodity and also the most expensive "intangible asset." A reliable "identification team" and a transparent traceability system are your strongest competitive barriers.

Fourth, establish matching algorithms (or at least the awareness of matching).

You need to know "who this batch of goods should be sold to." This is not the intuition of "I know which buyer needs this goods," but requires a systematic method to record, analyze, and predict buyer demand. In the AI era, this can completely be achieved with the help of technical means.

Fifth, establish network effects.

You need to let your information "become thicker as it spreads." This means you need to continuously create value for participants in your information network (buyers, sellers, industry observers), making them willing to stay in your network and willing to share information with you. A successful industry information network has a "flywheel effect": more people joining the network → information in the network becomes richer → the value of the network to participants becomes greater → more people are willing to join.

Chapter 4: Implications for the Industry's Future

4.1 Three Inevitable Trends

Based on the above analysis, we believe the branded inventory trading industry is (or is about to be) undergoing three structural transformations:

First Trend: From "Warehouse Density" to "Information Density."

Future industry stars will no longer be "wholesalers with the largest warehouse area," but "data intermediaries with the widest information coverage." This means the core competitive elements of the industry are shifting from "capital scale + warehouse capacity" to "information collection capability + matching algorithm + trust endorsement."

Second Trend: From "Transaction Facilitation" to "Service Premium."

In a market with oversupply, the value of simply "bringing buyers and sellers together" is decreasing, because oversupply = buyer's market = buyers have enough choices. At this time, the intermediary's "value-added service" capabilities — such as condition identification, logistics fulfillment, financial advance, and channel customization — begin to show differentiated value.

Third Trend: From Small Circles to Networks.

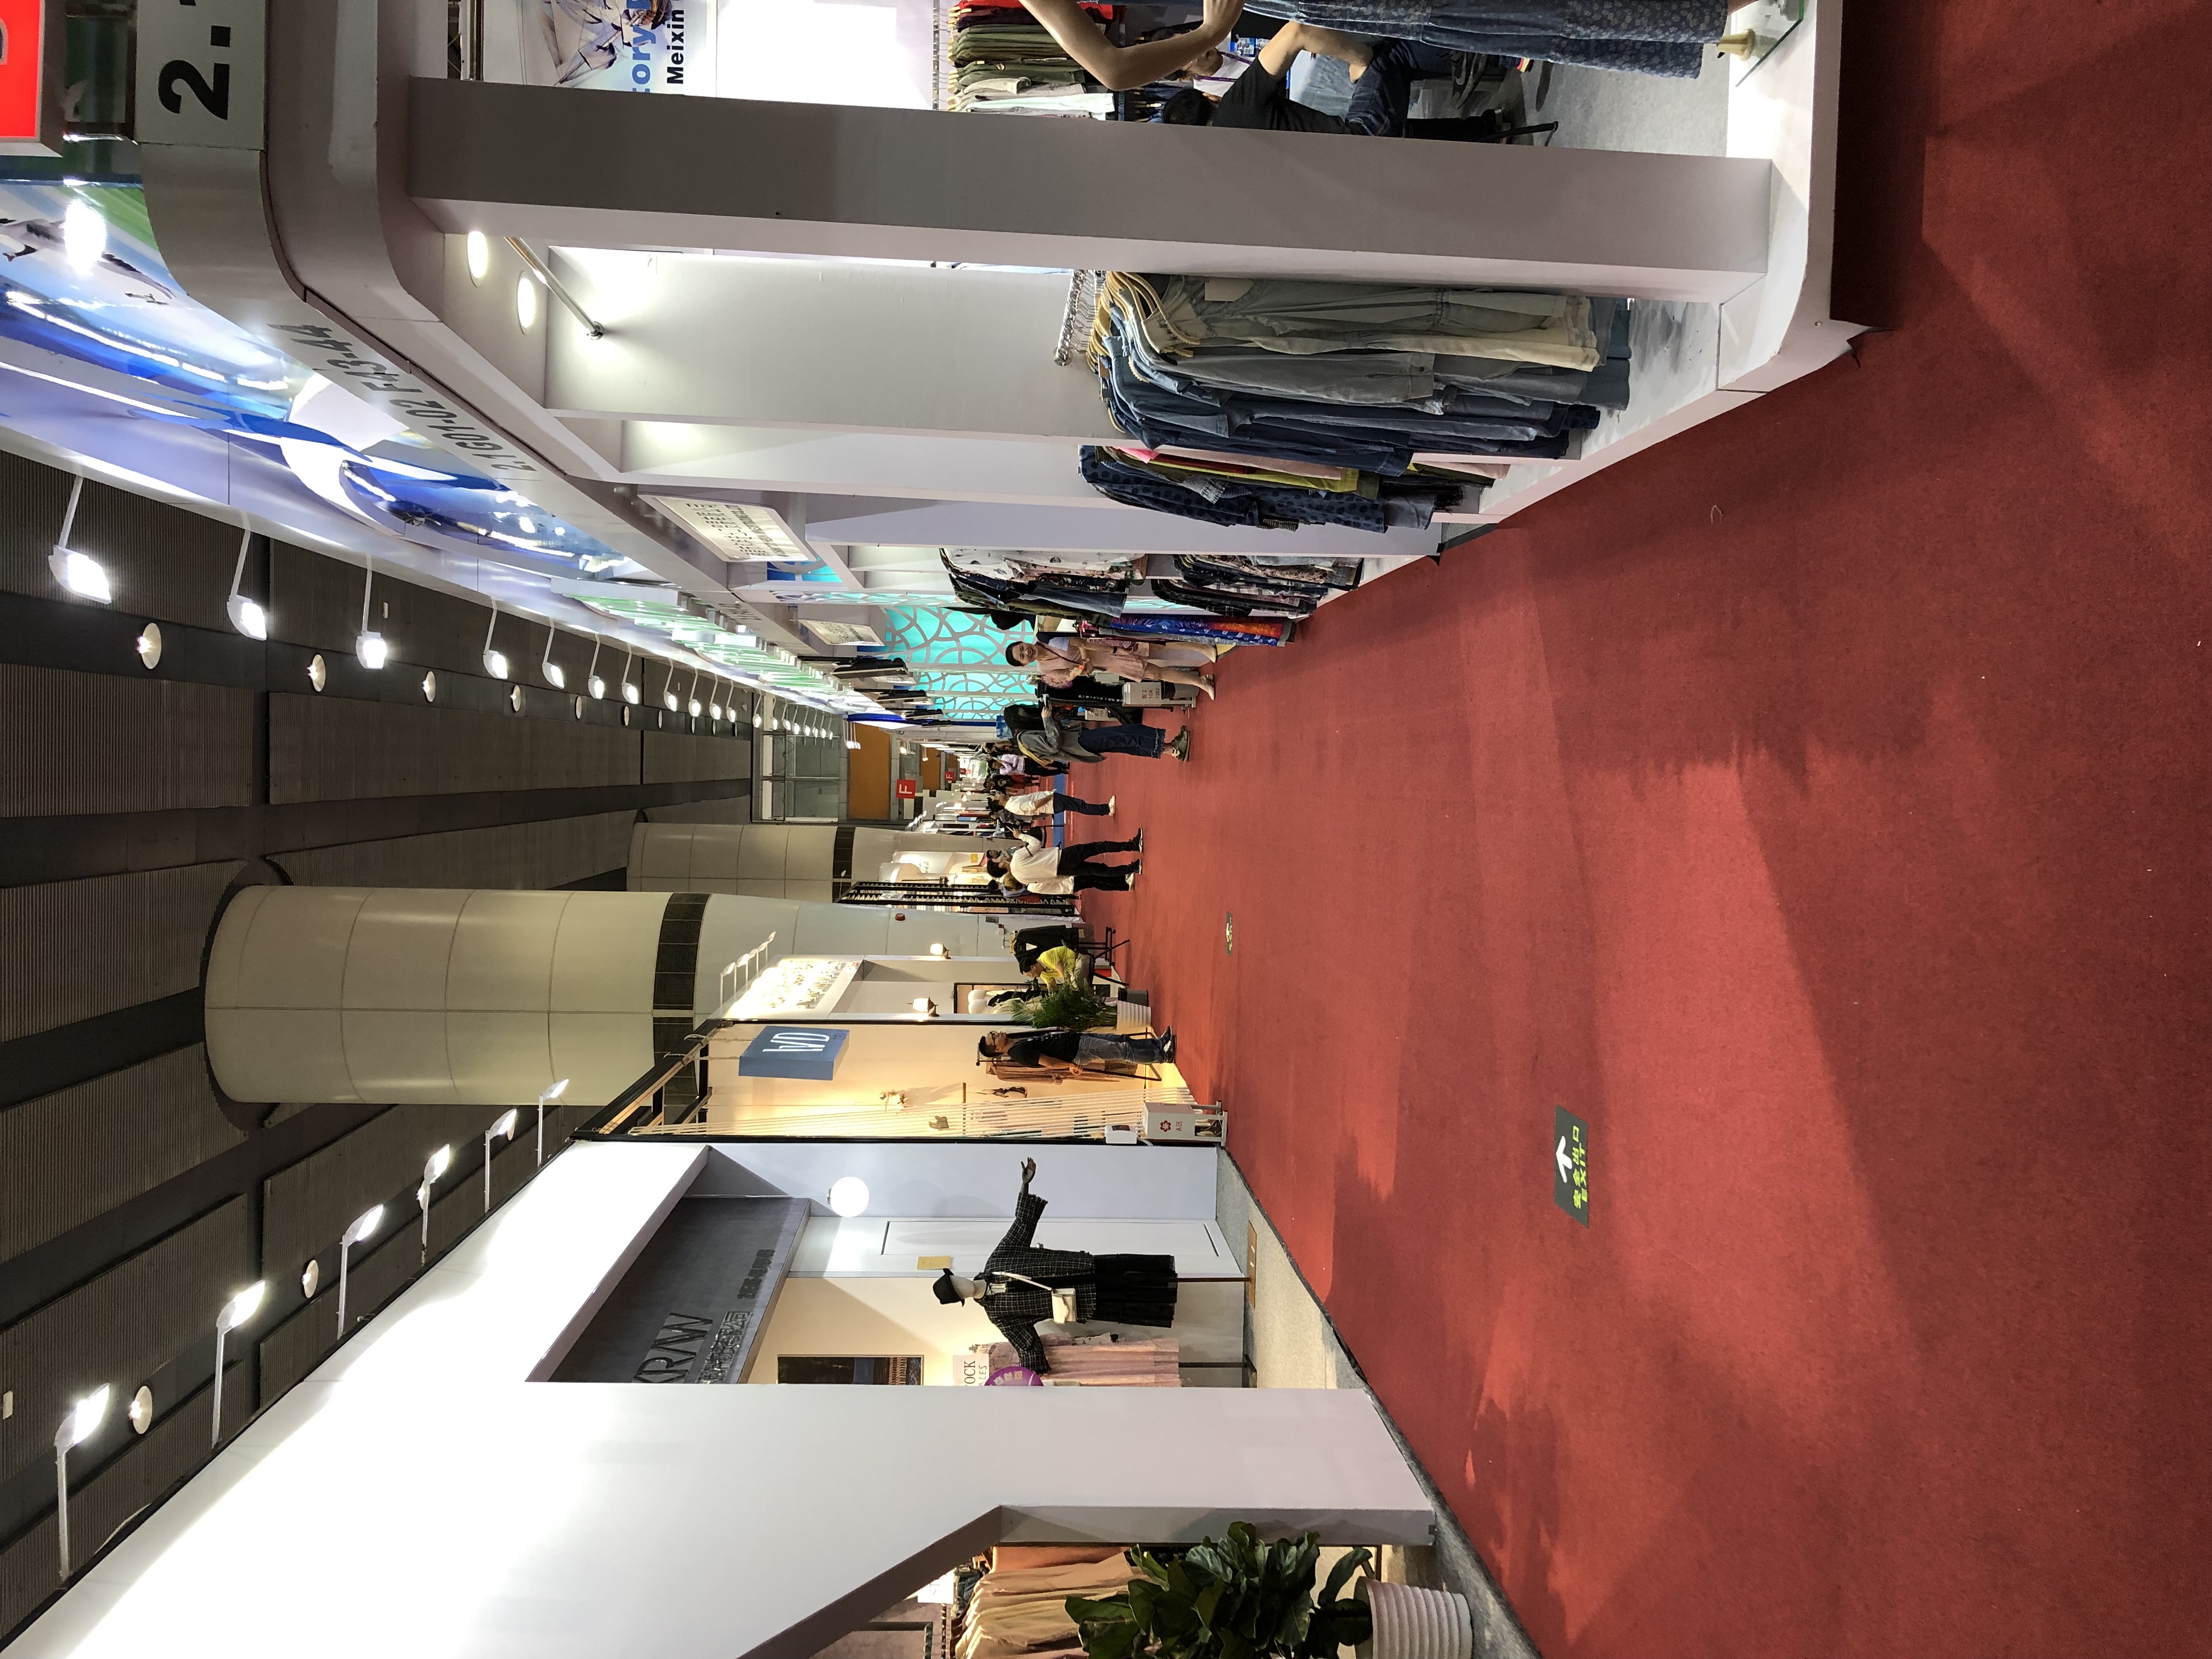
Traditional inventory trading highly relies on the "circle" of acquaintance society — a prefecture-level city's apparel wholesale market is essentially an information network woven by kinship, fellow-townsman, and alumni relationships. The defect of this model is: the speed and breadth of information flow are limited by the physical boundary of the "circle." Social tools and B2B platforms in the 2020s are breaking this boundary, connecting "information islands" scattered in different cities and different channels into a larger network. Those who embrace this change first will obtain the bonus (excess return) of "network effects."

4.2 Action Priorities

If you are a practitioner hoping to stand out in the next stage of competition, we should prioritize the following three action directions:

Action 1: Build Your Own "Industry Information Desk."

Even if you do not have a technical background, you should start using tools like Excel/Notion/Airtable to systematically record your "industry knowledge" — including supplier profiles, buyer demand logs, historical transaction records, and market price trend charts. This is the starting point of a "data flywheel": every piece of information you record today will save you search time tomorrow.

Action 2: Build Your "Minimum Viable Information Network."

Do not try to build a grand information system covering the entire industry from the beginning. Start with a smallest, high-frequency "information source" — for example: three trustworthy supplier contacts, five buyer clients with continuous demand, and one daily-updated industry information subscription source. Then, gradually expand the boundary of this network.

Action 3: Invest in Your "Trust Assets."

Every time you provide accurate information to a buyer, every time you stand on the side of justice in a transaction dispute, every time you provide a "pitfall avoidance guide" to a novice buyer — you are making a valuable "deposit" into your "trust account." In an industry with information asymmetry, trust is the most scarce "hard currency" and also the "asset" you should most consciously invest in.

Conclusion: Let the Information Flywheel Turn

Returning to the three core arguments at the beginning of this report:

  1. Inventory products are specific non-standard goods — they cannot be simply labeled, each SKU is a unique combination of time, channel, size, and condition.
  2. Information resources far outweigh inventory — in a market with oversupply and information fragmentation, knowing "what kind of goods this batch is, who it should be sold to, and how much it is worth" is more important than holding "this batch of goods" in hand.
  3. Do not worship inventory wholesalers — they often bear the triple pressure of capital lockup, price fluctuations, and information lag. What is truly valuable is not their warehouse, but the industry experience and relationship network they have accumulated over the years.

In the next battle of inventory trading, the starting gun is not "how much money you have," but "how much you know" — and whether you have the ability to transmit the information you know to those who need to know.

May every practitioner become the person who "lets the information flywheel turn."

Source: Internal Analysis by Tianjin Nice Partner Trading Co., Ltd. Research Team

Tianjin Nice Partner Trading Co., Ltd. | nicepartnertrading.com

🔥 BREAKING NEWSPayPal Officially Integrates with WeChat Pay — Global Users Can Now Scan WeChat Pay QR Codes in China
📅 May 30, 2026

📢 BREAKING: On May 27, 2026, at the 20th Shenzhen International Financial Expo, Tencent officially announced that PayPal and WeChat Pay have achieved full interoperability. U.S. PayPal users can now pay at tens of millions of WeChat Pay merchants in China — zero friction, zero cost for merchants.

The Announcement

On May 27, 2026, at the opening forum of the 20th Shenzhen International Financial Expo, Tencent — together with the Shenzhen Local Financial Supervision Administration, the People's Bank of China Shenzhen Branch, and the Shenzhen Qianhai Management Authority — officially launched the "2026 Inbound Payment Convenience Upgrade Action."

"TenPay Global (Tencent's cross-border payment platform) and PayPal World have achieved interoperability. PayPal users visiting China can now make seamless payments at tens of millions of WeChat Pay merchants — simply by opening their PayPal wallet."

Hong Danqi, VP Tencent FinTech

How It Works

  • Scan to Pay: PayPal users scan a WeChat Pay merchant QR code with the PayPal app
  • Code Display: PayPal users display their PayPal payment code to be scanned by merchants
  • Full Coverage: Both modes supported — all in-store payment scenarios covered
  • No Extra Account: No WeChat Pay account required for PayPal users
  • Zero Merchant Cost: No device or QR code changes required for merchants

Why This Matters

1. The "Last Mile" of Inbound Payment Is Unlocked 🔓

Foreign visitors to China have long faced a "payment wall" — Alipay and WeChat Pay required Chinese bank accounts for full functionality. The direct interoperability between PayPal and WeChat Pay allows over 400 million active PayPal users (starting with U.S. users) to consume in China with zero onboarding friction.

2. Policy Signal from Regulators 🏛️

This is not an isolated commercial partnership. The "2026 Inbound Payment Convenience Upgrade Action" was jointly launched with the Shenzhen Local Financial Supervision Administration and the PBOC Shenzhen Branch, signaling clear regulatory support for cross-border payment facilitation.

3. Business Impact for Cross-Border Traders 💼

For import/export companies like Tianjin Nice Partner Trading Co., Ltd., this development has practical business value:

  • U.S. buyers visiting China for inspection can use their familiar PayPal wallet for dining, transport, and accommodation
  • Reduced friction for foreign buyers to visit trade fairs (Canton Fair, CIIE), potentially increasing on-site purchasing decisions
  • As more countries/regions are added, the convenience dividend will expand, indirectly boosting cross-border trade activity

Rollout Timeline

Phase Region Status
Phase 1 United States ✅ OPEN (May 27, 2026)
Phase 2 Europe / UK Planned — timeline TBD
Phase 3 Southeast Asia Planned — timeline TBD
Phase 4 Japan / South Korea Planned — timeline TBD

Other Developments to Watch 👀

  • Alipay (Alipay+) may announce similar international wallet interoperability
  • B2B micro-cross-border payment scenarios — potential future expansion beyond consumer payments
  • More international cards (Visa/Mastercard) directly bindable in WeChat Pay for non-PayPal users

Sources: China Financial News (2026-05-29) · East Money (2026-05-28) · 10JQKA (2026-05-27) · Sina Finance (2026-05-28) · Tencent News (2026-05-29)

Tianjin Nice Partner Trading Co., Ltd. | nicepartnertrading.com

⚠️ SPECIAL REMINDER The "Sanitized Invoice" Myth: Why Requiring Paperwork Before the Deal Is Killing Your Margins
📅 May 16, 2026

⚠️ SPECIAL REMINDER: This article addresses a common misconception in fashion wholesale that can significantly impact your profit margins. Share this with your procurement team.

Opening: The Trap

If you've been in the fashion wholesale game for more than a week, you've heard it:

"No sanitized invoice, no cooperation."

It sounds responsible. It sounds like due diligence. It sounds like you're protecting yourself.

It's not. It's killing your margins — and limiting your business to a single, expensive path.

What a Sanitized Invoice Actually Is (and Isn't)

Let's be very clear about what that piece of paper represents.

A sanitized invoice is proof that the company you're dealing with purchased that batch of goods. That's it. It proves ownership transfer. It does NOT prove that the goods are sitting in the warehouse ready to ship. It does NOT prove the goods correspond to that specific piece of paper in any meaningful operational sense.

This is a very simple truth that gets lost in the paperwork obsession: the invoice is a financial document, not an inventory snapshot.

The Hidden Cost You're Absorbing

Here's what happens when you insist on a sanitized invoice before cooperation:

  1. The distributor has already bought the goods — so they're sitting in a warehouse somewhere, occupying space, accruing storage costs every day.
  2. Those warehouse costs get passed on. Guess who pays? The customer. That's you.
  3. The distributor's working capital is tied up in inventory that hasn't even been ordered yet. They price that risk into the unit cost.

So by the time you see that "authentic" sanitized invoice, the cost structure of the deal has already been inflated by storage, capital tie-up, and risk premium.

The Smarter Model: Brand-Direct Distribution

There's a better way. In this model:

  • The brand or distributor holds the inventory at their own warehouse
  • No sanitized invoice exists yet — because no purchase has been made
  • The invoice is generated only after the order is confirmed
  • Warehouse costs, capital tie-up, and risk stay with the brand/distributor until the deal is real

This is how most legitimate brand distribution works. The invoice comes after the order, not before. Requiring it before is like demanding a shipping receipt before you've even decided what to buy.

Why This Matters for Sports Brands (and All Fashion Brands)

Many fashion and sports brands do not provide sanitized invoices upfront. I've seen this firsthand in Hangzhou warehouse operations. It's normal. It's not a red flag.

If you rule out every partner who can't show you a sanitized invoice on day one, you're eliminating the exact partners who have the most flexible, cost-efficient supply chains. You're limiting yourself to distributors who've already tied up capital in inventory — and guess what, they need to charge you more to make up for it.

The Bottom Line

Next time someone tells you "no sanitized invoice = not authentic," ask them:

"Whose warehouse is this inventory sitting in right now? And who's paying for that storage?"

Key Takeaway:

The invoice is not the product. The goods are the product. Keep the difference clear, and your margins will thank you.


About the Author

Tianjin Nice Partner Trading Co., Ltd. specializes in branded fashion and sportswear wholesale. We work directly with brand distributors and help buyers navigate the real economics of the wholesale market — beyond the paperwork.

Contact us: Pate@nicepartnertrading.com | Website: www.nicepartnertrading.com

Published by Tianjin Nice Partner Trading Co., Ltd. — This article is for reference only, not constituting business or investment advice.

GeopoliticsBreaking News: Trump's Visit to China (May 13-15, 2026)
📅 May 14, 2026

U.S. President Donald Trump pays a state visit to China from May 13-15, 2026, at the invitation of President Xi Jinping. This is the first U.S. president to visit China in 9 years, and the first face-to-face meeting between the two leaders since the Busan meeting in October 2025.

Key Objectives:

  • Stabilize China-U.S. relations and manage differences
  • Consolidate and expand trade "truce" agreement (tariffs reduced from 145% to ~30%)
  • Supply chain stability and AI governance coordination
  • Iran issue and international hotspot coordination
  • Set tone for post-Trump era China-U.S. relations

Delegation Highlights:

  • Technology giants: Elon Musk (Tesla), Tim Cook (Apple), Jensen Huang (NVIDIA)
  • Wall Street CEOs: Goldman Sachs, Blackstone, BlackRock, Citigroup
  • No defense contractors — signal of "cooperation first" approach

Predictions for China-U.S. Relations:

  • Optimistic scenario (35%): Substantive trade agreements, tech controls relaxation
  • Neutral scenario (45%): Joint statement, partial cooperation restart
  • Pessimistic scenario (20%): No results, tariff war escalation

Impact on Global Trade:

  • China-U.S. trade truce benefits global supply chain restructuring
  • Southeast Asian orders may flow back to China (Vietnam 46%, Cambodia 49% U.S. tariffs)
  • Iran coordination could ease Strait of Hormuz tension, oil prices may fall to $90-100

Business Implications for Tianjin Nice Partner Trading Co., Ltd.:

  • Tariff dividend: cost reduction on apparel & footwear surplus inventory
  • Supply chain stability: reduced logistics uncertainty
  • Southeast Asia order return: seize "return dividend" as China regains competitiveness
  • Risk warning: Maintain "China+1" strategy for supply chain resilience

Source: Chinese Ministry of Foreign Affairs, Bloomberg, CCTV News, Eastmoney, China Daily | Published May 14, 2026

Written by: Tianjin Nice Partner Trading Co., Ltd. Analysis Report — This report is for reference only, not constituting investment or business decision advice.

Global Trade Doing Business with China: A Global Perspective on Trade, Risks & Opportunities
📅 May 10, 2026

China remains the world's largest trading nation, with 249 countries and regions conducting trade in 2025. Its total trade volume reached record highs, driven by diversified partnerships across ASEAN, the EU, Central Asia, Africa, and Latin America. Yet, doing business with China presents an increasingly complex landscape shaped by geopolitical tensions, rising tariffs, regulatory uncertainty, and supply chain disruptions.

Key Findings:

  • China's trade with 249 partners reached record levels in 2025, with ASEAN as the #1 partner (¥23.76 trillion, +9.2% YoY).
  • U.S. tariffs on Chinese goods peaked at 145% before retreating to 30% after Geneva talks in May 2025.
  • 67% of U.S. companies with Chinese suppliers have maintained relationships for over 5 years — strong supply chain stickiness.
  • Southeast Asian countries (Vietnam 46%, Cambodia 49%, Thailand 36%) face higher U.S. reciprocal tariffs than China itself — undermining the "China+1" strategy.
  • Central Asia is the fastest-growing trade corridor, surpassing $100 billion for the first time.
  • Large buyers are not leaving China — they are complicating their relationship with China, maintaining China as the indispensable core.

The Tariff Rollercoaster (2025):

  • February 2025: Additional 10% tariff imposed on Chinese goods
  • Layered with "fentanyl tariffs" and "reciprocal tariffs" — cumulative rate peaked at 145%
  • May 11, 2025: Geneva talks — U.S. cancelled 91% of additional tariffs, suspended 24% — effective rate ~30%
  • Post-Geneva impact: Partial "re-shoring" of orders back to China in apparel and footwear

Strategic Implications for Global Buyers:

  • North America: Calculate true landed cost — SEA tariffs may be higher than China after all
  • EU: Leverage EU-China agreements; focus on green tech and premium segments; prepare for CBAM compliance
  • SE Asia: Use ASEAN-China FTA for tariff reduction; maintain dual-source capability
  • Africa: Partner with experienced China trading companies; leverage BRI infrastructure
  • Latin America: Focus on complementary trade; build local value-add to avoid commodity trap

The report draws on the latest data from 2024-2026, including surveys from AmCham China, the U.S.-China Business Council (USCBC), China Customs, and industry reports — providing actionable intelligence for SMEs and large buyers alike.

Source: AmCham China, USCBC, China Customs, westOeast 2025 Survey | Published May 2026

Canton Fair 139 Canton Fair 139th Session: Historic Highs & Supply Chain Implications
📅 May 6, 2026

The 139th session of the China Import and Export Fair (Canton Fair) has concluded with record-breaking participation, signaling strong global demand for Chinese manufacturing and reinforcing the trend of supply chain reshoring to China driven by tariffs and energy costs.

Key Scale Metrics:

  • Exhibition Area: 1.55 million m² (historical high)
  • Exhibiting Enterprises: 30,000+ (historical high)
  • Total Exhibits: 4.65 million (1.55× vs 133rd session)
  • Overseas Buyers: 314,000+ from 220 countries (+1.1%, historical high)
  • Professional Buyer Ratio: First time exceeding 70%
  • Pre-registered Professional Buyers: 210,000+ (+20%, historical high)

Global Buyer Composition:

  • Top 407 MNC headquarters buyers (+30%)
  • 154 overseas business delegations (+17.5%)
  • Belt & Road countries: +26% YoY
  • European buyers: +44% YoY
  • Emerging market share: 50.08%

Quality Manufacturing Showcase:

  • High-quality exhibitors (national high-tech, gazelle, champion): 11,000
  • Zhejiang brand booths: 32.9% of national total (ranked #1)
  • Mechanical & electrical products: first time exceeding 60%

Q1 Export Highlights:

  • EV exports: +77.5% YoY
  • Lithium battery exports: +50.4% YoY
  • Wind power equipment exports: +45.2% YoY
  • Medical device exports: $12.585B (+8.92% YoY)
  • Massage & healthcare equipment: $1.079B (+4.3% YoY)

Implications for Apparel & Footwear Supply Chain:

The textile and apparel zone recorded strong interest, particularly from emerging markets. About 20% of exhibitors have overseas investments, creating over 200,000 local jobs abroad — a two-way flow that reinforces China as the anchor of global supply chains.

Source: Canton Fair Official Data, China Customs, MOFCOM | Published April 2026

Market Insight Global Supply Chain: When the "Water" Runs Low — A Bucket Metaphor
📅 April 25, 2026

【English Version】


Global Apparel & Footwear Supply Chain: When the "Water" Runs Low

The global apparel and footwear manufacturing landscape is concentrated among a handful of key regions — China, Vietnam, Bangladesh, India, Turkey, and Indonesia.

When a global energy crisis hits, these regions face radically different outcomes.

Think of it this way: Each country is like a wooden bucket. Global energy supply is the water inside.

• - Some countries have **small buckets with little water** — thin energy reserves, heavy reliance on imports. When supply tightens, production stalls.

• - Some countries have **large buckets, well-stocked** — diversified energy mix, strong domestic capacity. Even when external markets fluctuate, they keep their factories running.

When the drought arrives and all the small buckets begin to drain, where do people turn?

They search for the one still holding water.

**This is exactly where we are today.**

In calm times, people choose their bucket based on color, brand, or a neighbor's recommendation.

But when real crisis hits — when the drought becomes real — aesthetics no longer matter.

The only question that matters is: **Which bucket still has water?**

And that time is now.


Market Intelligence Global Apparel & Footwear Inventory Surplus — Market Share Estimate Report
📅 April 23, 2026

GLOBAL APPAREL & FOOTWEAR INVENTORY MARKET | INDUSTRY ESTIMATE

Tianjin Nice Partner Trading Co., Ltd.

Tianjin Nice Partner Trading Co., Ltd.

Page 1April 2026

GLOBAL APPAREL & FOOTWEAR

INVENTORY / SURPLUS MARKET ESTIMATE

II INDUSTRY ESTIMATE — NOT OFFICIAL STATISTICS

Prepared by: Tianjin Nice Partner Trading Co., Ltd.

Date: April 2026Based on: Production Data + Industry Knowledge + Surplus Rate Estimates

II IMPORTANT DISCLAIMER

This report contains INDUSTRY ESTIMATES, not official statistics. There is NO global database of

inventory/surplus market share by country. The figures below are derived from: (1) Official production/export

data; (2) Estimated surplus generation rates by country; (3) Industry knowledge of inventory markets. Use

these figures for strategic planning only — they should NOT be cited as authoritative data.

EST. GLOBAL

INVENTORY MARKET

$275–355 billion

Annual Surplus Volume

TOP 5 COUNTRIES

~75% of global

Inventory Generation

DATA BASIS

Export Data +

Surplus Rate Estimates

ACCURACY

±15–25%

Best Effort Estimate

METHODOLOGY

Since no official inventory market statistics exist, we estimate country market share using the following formula:

ESTIMATED INVENTORY SHARE

=

Export Volume × Surplus Rate

IIIIIIIIIIIIIIIII

Global Inventory Volume

Surplus Rate Estimates by Country Type:

COUNTRY TYPE

SURPLUS RATE RATIONALE

Major manufacturers (China, Bangladesh, Vietnam)

12–18%

Large-scale production, order cancellations, overproduction

Mid-tier exporters (Turkey, India, Indonesia) 10–15%

Mixed domestic/export, seasonal surplus

Niche producers (EU luxury, specialty)

8–12%

Smaller volumes, premium positioning, tighter inventory

Emerging hubs (Ethiopia, Kenya, Myanmar) 15–25%

Quality issues, order cancellations, capacity volatility

Import-dependent (US, EU, Japan)

5–8%

Primary consumption markets, closeout resale not production

GLOBAL APPAREL & FOOTWEAR INVENTORY MARKET | INDUSTRY ESTIMATE

Tianjin Nice Partner Trading Co., Ltd.

Tianjin Nice Partner Trading Co., Ltd.

Page 2April 2026

I. ESTIMATED INVENTORY MARKET SHARE — TOP 50 COUNTRIES

The following table presents estimated annual inventory generation volume by country, calculated as: Export

Value × Estimated Surplus Rate. Global inventory market estimated at $300 billion annually.

#

COUNTRY

EST. INVENTORY

SHARE

SURPLUS

RATE

KEY DRIVERS

1

China II

$40–55 billion

15.0%

12–18%

Overproduction, brand orders, energy-stable

2

Bangladesh III

$8–12 billion

• 3.5%

18–25%

Factory closures, EU order cancellations

3

Vietnam II

$6–9 billion

• 2.5%

15–23%

42,900 factories suspended, tariff shock

4

India II

$4–7 billion

• 1.8%

10–17%

Growing production, seasonal surplus

5

Turkey III

$3–5 billion

• 1.3%

12–20%

Energy crisis, EU proximity

6

Indonesia II

$2–4 billion

• 1.0%

15–20%

Brand order cancellations, overproduction

7

Pakistan IIII

$1.5–2.5 billion

0.7%

12–18%

Cotton surplus, forex crisis

8

Cambodia III

$1–2 billion

0.5%

15–20%

Low-cost production, order volatility

9

Mexico III

$1–2 billion

0.5%

8–15%

USMCA orders, seasonal surplus

1

0

Myanmar II

$0.8–1.5 billion

0.4%

18–25%

Factory closures, civil unrest

1

1

Sri Lanka IIII

$0.7–1.2 billion

0.3%

15–20%

Economic crisis, overcapacity

1

2

Italy III

$2–3 billion

0.8%

8–12%

Luxury brand surplus, high-value closeout

1

3

USA II

$3–5 billion

• 1.3%

5–8%

Domestic brand inventory, closeout market

1

4

Germany II

$1.5–2.5 billion

0.6%

8–12%

Premium surplus, technical textiles

1

5

France II

$1.5–2 billion

0.5%

8–12%

Luxury inventory, fashion closeout

1

6

UK II

$1–1.5 billion

0.4%

8–12%

Fashion inventory, Brexit adjustments

1

7

Spain III

$1–1.5 billion

0.4%

8–12%

Fast fashion surplus, seasonal

1

8

Portugal III

$0.5–0.8 billion

0.2%

10–15%

EU-made positioning, premium surplus

1

9

Romania IIII

$0.4–0.6 billion

0.15%

10–15%

EU production, export surplus

2

0

Poland II

$0.3–0.5 billion

0.12%

10–15%

EU logistics hub, inventory trade

2

1

Egypt II

$0.4–0.6 billion

0.15%

12–18%

Cotton production, regional demand

2

2

Morocco III

$0.4–0.6 billion

0.15%

10–15%

EU FTA, denim production

GLOBAL APPAREL & FOOTWEAR INVENTORY MARKET | INDUSTRY ESTIMATE

Tianjin Nice Partner Trading Co., Ltd.

Tianjin Nice Partner Trading Co., Ltd.

Page 3April 2026

#

COUNTRY

EST. INVENTORY

SHARE

SURPLUS

RATE

KEY DRIVERS

2

3

Tunisia III

$0.3–0.5 billion

0.12%

10–15%

EU market, knitwear surplus

2

4

Jordan II

$0.3–0.4 billion

0.1%

10–15%

US QIZ, duty-free access

2

5

Ethiopia IIIII

$0.2–0.3 billion

0.07%

18–25%

Emerging hub, quality issues

2

6

Kenya III

$0.2–0.3 billion

0.07%

15–20%

AGOA access, growing production

2

7

Thailand II

$0.8–1.2 billion

0.3%

10–15%

Synthetic fabrics, mixed economy

2

8

Brazil II

$0.5–0.8 billion

0.2%

10–15%

Domestic market, footwear surplus

2

9

Honduras IIII

$0.3–0.5 billion

0.12%

10–15%

CAFTA-DR, US market

3

0

Guatemala IIII

$0.3–0.4 billion

0.1%

10–15%

CAFTA-DR, basic apparel

3

1

Nicaragua IIII

$0.2–0.3 billion

0.08%

12–18%

CAFTA-DR, denim production

3

2

El Salvador IIII

$0.2–0.3 billion

0.08%

10–15%

CAFTA-DR, T-shirts

3

3

South Africa II

$0.2–0.3 billion

0.07%

10–15%

Regional hub, limited export

3

4

Lesotho III

$0.15–0.2 billion

0.05%

15–20%

AGOA access, low-cost production

3

5

Madagascar

IIIII

$0.1–0.2 billion

0.04%

15–20%

AGOA, emerging production

3

6

UAE III

$1–2 billion

0.5%

N/A

Re-export hub, not production

3

7

Saudi Arabia II

$0.3–0.5 billion

0.12%

N/A

Local production, import surplus

3

8

Japan II

$1–1.5 billion

0.4%

5–8%

Premium surplus, technical textiles

3

9

South Korea II

$0.8–1.2 billion

0.3%

8–12%

K-brand surplus, technical fabrics

4

0

Taiwan II

$0.5–0.8 billion

0.2%

8–12%

Specialty production, brand orders

4

1

Nepal III

$0.1–0.15 billion

0.03%

15–20%

Low-cost, niche production

4

2

Ghana II

$0.08–0.12 billion

0.025%

15–20%

AGOA access, emerging

4

3

Mauritius IIII

$0.1–0.15 billion

0.03%

10–15%

Premium positioning, small-scale

GLOBAL APPAREL & FOOTWEAR INVENTORY MARKET | INDUSTRY ESTIMATE

Tianjin Nice Partner Trading Co., Ltd.

Tianjin Nice Partner Trading Co., Ltd.

Page 4April 2026

#

COUNTRY

EST. INVENTORY

SHARE

SURPLUS

RATE

KEY DRIVERS

4

4

Bulgaria IIII

$0.1–0.2 billion

0.04%

10–15%

EU access, footwear

4

5

Ukraine III

$0.05–0.1 billion

0.015%

15–25%

War disruption, production halted

4

6

Peru II

$0.15–0.25 billion

0.05%

10–15%

Alpaca, specialty fibers

4

7

Colombia IIII

$0.2–0.3 billion

0.07%

10–15%

Andean market, growing exports

4

8

Chile II

$0.05–0.1 billion

0.015%

8–12%

Limited production, import market

4

9

Argentina III

$0.1–0.2 billion

0.04%

10–15%

Domestic market, limited export

5

0

Others II

$200–250 billion

68%

-

All other countries combined

GLOBAL APPAREL & FOOTWEAR INVENTORY MARKET | INDUSTRY ESTIMATE

Tianjin Nice Partner Trading Co., Ltd.

Tianjin Nice Partner Trading Co., Ltd.

Page 5April 2026

II. REGIONAL INVENTORY MARKET DISTRIBUTION

REGION

EST. SHARE KEY COUNTRIES

CHARACTERISTICS

Asia-Pacific

70–75%

China, Bangladesh, Vietnam, India, Indonesia, Pakistan

Manufacturing hub, largest surplus generation

Europe

10–12%

Turkey, Italy, Germany, France, Spain, Portugal

Premium surplus, luxury closeout, EU production

Americas

6–8%

USA, Mexico, Brazil, Central AmericaCloseout market, brand inventory, domestic production

MENA

3–5%

Turkey, Egypt, Morocco, Tunisia, Jordan, UAE

EU proximity, re-export hub, growing production

Africa

2–3%

Ethiopia, Kenya, Lesotho, Madagascar, South Africa

Emerging hubs, AGOA access, quality challenges

III. KEY INSIGHTS FOR INVENTORY BUYERS

• 3.1 Top 5 Countries for Sourcing Inventory

RANK COUNTRY

WHY THEY HAVE INVENTORY

BUYER OPPORTUNITY

1

China

Largest production base, brand orders cancelled, energy-stable manufacturing continues

Widest variety, all price points, complete supply chain

2

Bangladesh

EU preferential access, factory closures, order cancellations from Western brands

Lowest cost, large volume, basic apparel focus

3

Vietnam

42,900 factories suspended, tariff uncertainty driving inventory buildup

Sportswear, branded closeout, footwear

4

Turkey

Energy crisis squeezing margins, EU proximity driving quick sales

Denim, outerwear, premium positioning

5

India

Growing production scale, seasonal surplus, domestic market volatility

Cotton products, casual wear, home textiles

• 3.2 2026 Inventory Market Drivers

• • US Tariff Shock: Trump's reciprocal tariffs (Vietnam 46%, Cambodia 49%) causing order cancellations and

inventory buildup.

• • Energy Crisis: Middle East conflict driving energy costs up; Southeast Asian factories facing fuel shortages,

forcing shutdowns.

• • Brand Inventory Clearance: Major brands (Nike, Adidas, H&M;, Zara) overstocked from 2024-2025,

accelerating closeout sales.

• • Middle East Reconstruction: Post-war demand for affordable apparel creating new buyer opportunities.

• • China's Stable Manufacturing: Energy-stable production making China the most reliable source for inventory

buyers.

• 3.3 Strategic Recommendations

• • Prioritize China + Turkey: These two markets offer the most stable supply chains and largest inventory pools.

• • Monitor Vietnam closely: Inventory buildup is accelerating due to factory closures and tariff uncertainty —

opportunity window.

• • Watch Middle East buyers: Post-war reconstruction is creating massive new demand for affordable inventory.

• • Diversify by product type: China for variety, Bangladesh for basics, Turkey for denim, Italy for luxury closeout.

GLOBAL APPAREL & FOOTWEAR INVENTORY MARKET | INDUSTRY ESTIMATE

Tianjin Nice Partner Trading Co., Ltd.

Tianjin Nice Partner Trading Co., Ltd.

Page 6April 2026

• • Time your purchases: Q2-Q3 2026 is an optimal window — inventory is peaking, prices are low, buyers have

leverage.

FINAL DISCLAIMER

THESE ARE INDUSTRY ESTIMATES, NOT OFFICIAL DATA. No government or international organization

publishes "inventory market share by country" statistics. This report is intended for strategic planning and

market understanding only. For precise data on specific products or countries, contact local trade

associations, customs authorities, or industry consultants.

Prepared by Tianjin Nice Partner Trading Co., Ltd. for internal strategic use. April 2026. All estimates are based on industry

knowledge and publicly available production/export data.

🔴 BREAKING Qiyuan Fengshang Fraud Scandal — Guangzhou Shijing Qingfeng Wholesale Market
📅 April 22, 2026

BREAKING: "Qiyuan Fengshang" Fraud Scandal Rocks Guangzhou Shijing Qingfeng Wholesale Market

Pregnant Buyer from Heilongjiang Duped in 85,000 RMB Inventory Deal, Multiple Victims Come Forward

Date: April 20, 2026

Location: Shijing Qingfeng Textile & Apparel Wholesale City, Baiyun District, Guangzhou — "Qiyuan Fengshang" Storefront

━━━━━━━━━━━━━━━━━━━━━━━━━━━━━━

INCIDENT OVERVIEW

On April 20, 2026, a heated confrontation erupted at Guangzhou's Shijing Qingfeng wholesale market. A pregnant woman from Heilongjiang Province, who had traveled over 3,000 kilometers to source inventory, staged a public protest after discovering she had been allegedly defrauded of 85,000 RMB (approximately $11,700 USD) by a vendor named "Qiyuan Fengshang" (奇缘风尚).

The buyer claims she purchased approximately 1,500 pieces of what was advertised as "branded clearance inventory" at 54-55.5 RMB per piece. Upon delivery, she discovered the goods were allegedly substituted with inferior, unbranded products — a practice known in the industry as "bait and switch."

━━━━━━━━━━━━━━━━━━━━━━━━━━━━━━

TIMELINE OF EVENTS

1. Product Selection & Order: The buyer visited Qiyuan Fengshang's showroom and selected a batch of clothing presented as "branded clearance goods." Satisfied with the sample quality, she placed an order for approximately 1,500 units at 54-55.5 RMB per piece, totaling 85,000 RMB.

2. Delivery Discrepancy Discovered: Upon receiving the shipment, the buyer noticed significant discrepancies. While the general silhouettes matched the samples, the fabric texture, workmanship, and labels were markedly inferior — suggesting the goods had been switched with generic, unbranded merchandise.

3. Failed Negotiations: The buyer contacted the seller requesting an exchange or refund. The seller allegedly refused all requests.

4. Public Protest: On April 20, the pregnant buyer traveled back to Guangzhou with the entire shipment, unloaded the goods at the store entrance, and used a loudspeaker to publicly expose the alleged fraud, displaying side-by-side comparisons of the sample versus delivered products.

5. Seller's Counter-Allegations: The store owner demanded the buyer display all 1,500 pieces for inspection, questioning: "Are you claiming all 1,500 pieces are defective?" The owner also challenged the buyer's initial quality inspection process.

6. Police Intervention: Local police arrived to mediate, but both parties remained confrontational and refused to back down.

7. Standoff: The buyer unloaded the entire shipment from her delivery truck onto the sidewalk, demanding piece-by-piece verification in front of witnesses.

━━━━━━━━━━━━━━━━━━━━━━━━━━━━━━

CORE DISPUTE: TWO COMPETING NARRATIVES

BUYER'S CLAIMS (Ms. Wang):

- Delivered goods' quality, labels, and fabric do not match showroom samples

- Purchased expecting branded clearance inventory, received generic merchandise

- Exchange request denied; seller previously offered 20,000 RMB partial refund during negotiations

- Questions why refund was offered if goods were legitimate

SELLER'S DEFENSE (Qiyuan Fengshang Owner):

- Claims Shenzhen-branded series has 85% accuracy rate, with 15% "mixed styles" being standard industry practice

- Cites 13-year track record in clearance inventory business, claims no vendor can guarantee every customer profits

- Offers double refund if goods are proven misrepresented, claims to have "nothing to hide"

- Closed social media comments after posting "truth-revealing" video, prompting accusations of lacking confidence

━━━━━━━━━━━━━━━━━━━━━━━━━━━━━━

ESCALATION: MORE VICTIMS EMERGE

As the incident gained traction on Chinese social media platforms, additional alleged victims came forward:

- Multiple buyers reported similar experiences with Qiyuan Fengshang, with losses ranging from several thousand to over ten thousand RMB

- A former employee alleged: worked for half a month without receiving wages, then was allegedly slandered by the owner

- Public records searches revealed the associated company has multiple ongoing disputes and legal cases

The owner's decision to disable comments on her "truth-revealing" video while claiming innocence has drawn widespread skepticism online, with netizens questioning: "If you have nothing to hide, why silence the discussion?"

━━━━━━━━━━━━━━━━━━━━━━━━━━━━━━

INDUSTRY IMPLICATIONS

This case highlights systemic vulnerabilities in China's wholesale apparel clearance market:

1. SAMPLE-TO-DELIVERY GAP: The practice of displaying high-quality branded samples while shipping inferior substitutes remains rampant in clearance inventory trading.

2. PROHIBITIVE COST OF RECOURSE: Out-of-town buyers face enormous logistical and financial barriers to pursuing claims, often making fraud economically viable for bad actors.

3. ABSENCE OF INDUSTRY STANDARDS: Claims like "85% accuracy rate" raise questions — is a 15% substitution rate acceptable? The industry lacks clear quality benchmarks.

4. REPUTATION IS EVERYTHING: In wholesale markets, trust is the currency. Incidents like this erode confidence across the entire ecosystem, affecting legitimate vendors.

━━━━━━━━━━━━━━━━━━━━━━━━━━━━━━

CURRENT STATUS

As of press time, the dispute remains unresolved and continues to generate significant social media attention. The case has sparked broader discussions about consumer protection in China's wholesale markets and the challenges facing small business owners sourcing inventory.

━━━━━━━━━━━━━━━━━━━━━━━━━━━━━━

SOURCES

- Sohu News: "Heilongjiang Woman Spends 85,000 on Branded Goods, Receives Generic Products — Pregnant Buyer Stages Public Protest, Multiple Victims Speak Out" (April 21, 2026)

- NetEase News: "Guangdong Vendor Exposed for Bait-and-Switch — Customer Spends 85,000 on Generic Goods, More Victims Come Forward" (April 21, 2026)

Report compiled: April 22, 2026

Official Data Real-Data Report: China Textile, Apparel & Footwear Exports to the World
📅 April 20, 2026

Official Export Data — 2024 Full Year

This report presents the latest real-data analysis of China's textile, apparel, and footwear exports to global markets, with a focus on the US market as the key destination. Data sourced from China Customs, the US Census Bureau, and the OTEXA (Office of Textiles and Apparel).

Key Export Figures

Metric Value Notes
China Total Textile ExportsUSD 301.1 billion+2.8% YoY (2024)
China Apparel Exports to USUSD 49.36 billion+8.08% YoY (2024)
HS 64 (Footwear) to USUSD 15.35 billionHS 6401–6406, broad coverage
Apparel Import Market Share (US)China 28.4%Largest supplier to US market
Footwear Import Market Share (US)China 58.1%Dominant in footwear

Section 1: Textile Exports

China's total textile exports (including fabrics, yarn, and made-up articles) reached USD 301.1 billion in 2024, representing a 2.8% year-over-year increase. This demonstrates China's irreplaceable position in the global textile supply chain despite ongoing diversification pressures.

Section 2: Apparel Exports

China's apparel exports to the US reached USD 49.36 billion in 2024, up 8.08% year-over-year. This growth occurred despite geopolitical tensions and tariff pressures, highlighting the deep-rooted dependency of US brands and retailers on Chinese manufacturing capacity and supply chain efficiency.

Section 3: Footwear Exports

The HS 64 footwear category (covering major footwear types: rubber/plastic footwear, leather footwear, and textile footwear) shows China commanding a 58.1% share of US footwear imports. This dominance is driven by the combination of manufacturing cost advantage, skilled workforce, and complete industrial ecosystem.

Market Intelligence Energy Price Surge: Impacts on the European & US Apparel & Footwear Industry
📅 April 15, 2026

Executive Summary

This report examines how the 2026 global energy price surge — driven by the Middle East conflict — is reshaping the European and US apparel & footwear industries. The disruption runs through a five-link chain: Crude Oil → Naphtha → PTA/MEG → Polyester Fiber → Fabric → Finished Apparel. As Brent crude hit $120+/barrel and European gas surged 93% in one month, manufacturers across Europe and Southeast Asia are facing unprecedented cost pressure — while China's energy-stable manufacturing base emerges as the primary beneficiary.

Key Energy Benchmarks

Energy Benchmark Price Level Change Date
Brent Crude Oil$120+/barrel+↑ 2022 highMarch 2026
European Gas (TTF)€61.85/MWh+93% in 1 month19 Mar 2026
PTA (CNY/t)CNY 9,500/t+35% from CNY 7,000Q1 2026
Polyester Fabric+15–20%Per meterApril 2026
US Natural Gas$3.5–4.5/MMBtu+↑ RisingQ1 2026

I. Global Energy Market Background

The intensification of the Middle East conflict in early 2026 triggered the most significant global energy supply shock since the 2022 Russia-Ukraine crisis. Three compounding factors created a near-perfect storm:

  • Qatar LNG facility damaged — Ras Laffan Industrial City key LNG facilities hit; repairs estimated at 3–5 years. This facility alone accounts for 17% of Qatar's LNG exports.
  • Strait of Hormuz disruption — One of the world's most critical oil shipping chokepoints saw severe congestion, directly impacting global tanker traffic.
  • Brent crude breach of $120/barrel — Hit in March 2026, the highest level since 2022, driven by supply disruption fears.

The following industrial chain shows how crude oil price increases translate into higher apparel & footwear costs:

① Crude Oil ($70→$120+/bbl) → ② Naphtha (Key petrochemical feedstock) → ③ PX → PTA/MEG (PTA: CNY 7,000→9,500/t, +35%) → ④ Polyester Fiber (+15–20% per meter) → ⑤ Finished Apparel (Retail price pressure)

Note: Global approximately two-thirds of all clothing contains synthetic (man-made) fibers derived directly from petroleum. Even cotton-based apparel faces indirect pressure via fertilizer, transport, and competing fiber markets.

II. Impact on the European Industry

Europe has been hit hardest by the 2026 energy crisis due to its structural dependence on imported energy. European natural gas prices surged 93% in a single month (March 2026), with the TTF benchmark reaching €61.85/MWh. Hungary's Prime Minister Viktor Orbán warned on April 4 that "a severe energy crisis is approaching" and called on the EU to "replenish oil and gas reserves at maximum speed from all possible sources."

European energy-intensive industries — including textiles, dyeing, and finishing — have already been forced to cut production by 20–30%. Industry analysts warn that without resolution, factory shutdowns will expand significantly.

Impact Area Severity Evidence
Textile ManufacturingCRITICALEnergy-intensive factories cutting 20-30% production
Synthetic Fiber ProductionCRITICALPTA/MEG costs up 35%, margins squeezed to zero
Dyeing & FinishingCRITICALEnergy costs = 30-40% of production cost
Fashion RetailHIGHConsumer price inflation limiting spending
Logistics & ShippingHIGHMan-Mandeb Strait blockade threatens 30% of global containers

III. Impact on the US Industry

The US Bureau of Labor Statistics reported on April 10, 2026 that March 2026 CPI rose 0.9% month-over-month — the largest monthly increase since June 2022 — pushing the annual CPI to 3.3%, the highest since 2024. Critically, apparel prices rose 1.0% in a single month in March 2026, signaling that the energy shock is now reaching American consumers at retail.

US Economic Indicator March 2026 Implication
CPI (YoY)3.3%Highest since 2024; energy-driven
CPI (MoM)+0.9%Largest monthly rise since June 2022
Apparel CPI (MoM)+1.0%Direct energy cost transmission
Core CPI (YoY)2.6%Excluding volatile food & energy

The US apparel & footwear industry faces a unique double shock: the Trump administration's "reciprocal tariffs" (imposing 46% on Vietnam, 49% on Cambodia, 36% on Thailand) combined with the global energy price surge. US buyers who shifted orders to Southeast Asia over the past decade now face energy disruption, tariffs making Vietnam 10–15% more expensive, and polyester raw material costs rising globally.

IV. Disruptions vs. Strategic Opportunities

Disruptions Opportunities
  • European textile factories facing shutdowns
  • Polyester fabric prices +15–20%, eroding margins
  • PTA raw material +35%, squeezing profit margins
  • Cotton prices rising for 5 consecutive weeks
  • Consumer prices rising in US & EU markets
  • Shipping disruption via Man-Mandeb Strait
  • EU energy-intensive industries cut 20–30% output
  • Brands face "sell more, earn less" paradox
  • China's stable energy: 315 GW solar + 119 GW wind added in 2025
  • China crude output hit historic high of 215M tonnes (2025)
  • China's complete petrochemical chain absorbs cost shocks
  • EU brands actively sourcing from China as backup
  • US buyers re-evaluating China vs. SE Asia cost equation
  • Energy-stable manufacturing = reliable delivery schedules
  • Circular fashion & sustainable brands gaining pricing power
  • Second-hand & thrift market growing

V. Key Opportunity: China as the Stable Manufacturing Anchor

The most significant strategic opportunity emerging from this crisis is China's energy stability advantage. While Europe and Southeast Asia face energy crises, China has achieved a remarkable energy diversification:

  • Solar: 315 GW of new solar capacity added in 2025 alone — more than the entire EU's installed base a decade ago
  • Wind: 119 GW of new wind capacity added in 2025, making China the world's largest wind energy producer
  • Crude oil: Domestic production hit a historic high of 215 million tonnes in 2025
  • Petrochemical self-sufficiency: China's PTA/MEG capacity is fully domestic — no import dependency for raw material supply
  • Manufacturing reliability: Chinese factories maintain 85–95% utilization rates while European competitors cut 20–30%

VI. Strategic Recommendations

For European & US Brands & Importers:

  • Diversify away from Europe as a manufacturing base — accelerate China + Turkey sourcing
  • Lock in long-term energy supply contracts now before prices rise further
  • Build strategic inventory buffers (1–2 quarters) to absorb price volatility
  • Re-evaluate Southeast Asia sourcing: energy risk + tariff risk = total cost risk
  • Engage Chinese suppliers with stable energy & complete supply chains as primary partners

For Chinese Suppliers & Trading Companies:

  • Position as the "energy-stable" alternative: emphasize reliable delivery in a disrupted global market
  • Actively reach out to European brands seeking supply chain alternatives
  • Offer flexible MOQs and rapid replenishment to capture orders fleeing Southeast Asia
  • Highlight domestic energy capacity and petrochemical integration in marketing materials

Conclusion

The 2026 energy price surge is not a temporary disruption — it is a structural inflection point for the global apparel & footwear industry. The five-link transmission chain from crude oil to finished garments is now permanently more expensive for any region that depends on imported energy and imported petrochemical raw materials.

Europe faces the most acute crisis: its energy-intensive textile industry is structurally uncompetitive without major renewable investment. The United States faces consumer-level inflation and a supply chain re-evaluation. China — with its complete domestic petrochemical chain, massive renewable energy buildout, and energy-stable manufacturing base — emerges as the primary beneficiary and the most reliable partner for global brands seeking supply chain resilience.

This report is prepared by Tianjin Nice Partner Trading Co., Ltd. for market intelligence purposes only. Data sourced from publicly available market reports, government statistics, and industry publications as of April 2026.

Market Intelligence Southeast Asia Apparel & Footwear Inventory Status Report — April 2026
📅 April 11, 2026

Executive Summary

The Southeast Asian apparel and footwear manufacturing sector is facing unprecedented challenges in 2026, with severe inventory imbalances, production disruptions, and structural shifts in global supply chains.

Southeast Asia has long been positioned as the world's next manufacturing hub, particularly for apparel and footwear. However, 2026 has brought a perfect storm of challenges that have severely impacted inventory management, production capacity, and overall sector stability. This report examines the current inventory status across Vietnam, Cambodia, Bangladesh, and other key manufacturing centers.

Factory Shutdowns & Key Findings

  • 42,900+ Vietnam factories affected
  • 2M+ Workers displaced from industrial zones
  • 2.1x Inventory turnover vs healthy 4x annually
  • Vietnam reports over 42,900 factory shutdowns as of April 2026, with foreign investors increasingly questioning the reliability of Southeast Asian manufacturing
  • More than 2 million workers have fled industrial zones, creating severe labor shortages during peak production seasons
  • Industry-wide inventory turnover has dropped to 2.1 times per year, significantly below the healthy benchmark of 4+ times annually
  • Power shortages have become normalized, with northern Vietnam industrial zones facing 30% electricity deficits and mandatory "3-days-on, 4-days-off" production schedules
  • Global brands including Nike, Adidas, and Puma are actively reducing orders from Vietnamese contractors and shifting production back to China or to alternative locations

Vietnam: Production Crisis & Inventory Challenges

Factory Shutdowns & Labor Exodus

Vietnam, the region's largest apparel and footwear manufacturer, is experiencing its most severe industrial disruption in decades. Over 42,900 factories have suspended operations as of April 2026. The crisis began with COVID-19 lockdowns but has been exacerbated by ongoing structural issues.

MetricDataSource/Period
Factories Shut Down42,900+April 2026
Workers Who Left2,000,000+Post-lockdown exodus
Industrial Zones AffectedHo Chi Minh City regionPrimary manufacturing hub
Peak Season ImpactWinter apparel productionNormally highest output period

Power Crisis: The New Normal

Electricity shortages have transitioned from occasional disruptions to a permanent feature of industrial operations. Vietnam Electricity Group (EVN) has publicly acknowledged 30% power deficits in northern industrial zones, forcing factories to operate on rotating schedules.

  • Standard schedule: "3 days on, 4 days off" or half-day operations
  • Factory owners report workers waiting at gates for power restoration notifications
  • Power issues began during 2025 dry season and have become weekly fixtures
  • Production capacity utilization has fallen below 50% in many facilities

Regional Overview: Cambodia, Bangladesh & Beyond

Cambodia: Structural Vulnerabilities

Cambodia's apparel and footwear sector faces mounting pressures from compliance tightening, supply chain fragility, and management challenges.

  • Management challenges: Young workers prefer gig economy jobs over factory work
  • Factory capacity utilization below 50% due to labor shortages
  • Compliance and audit challenges creating barriers to international orders
  • Trade policy uncertainties affecting investor confidence

Bangladesh: Energy Dependency Crisis

Bangladesh remains heavily dependent on imported fuel (95% dependency rate), making it particularly vulnerable to the ongoing Middle East energy crisis.

CountryFuel Import DependencyKey ChallengeImpact Level
VietnamMajority imported30% power deficitSevere
Cambodia~100%Labor shortage, complianceHigh
Bangladesh95%Nationwide blackoutsExtremely Severe
Sri Lanka99%Fuel rationing, transport collapseCritical
ThailandPartialProduction line haltsModerate

Global Context: The Inventory Oversupply Crisis

Industry-Wide Inventory Challenges

The inventory crisis extends beyond Southeast Asia. Global apparel brands and manufacturers are grappling with excess stock, reduced demand, and disrupted supply chains.

Indicator2025-2026 DataBenchmark/Comparison
Industry Avg Inventory Turnover2.1x per yearHealthy: 4x+ per year
China Apparel Export Growth+4.3% volume, -5% valueSelling more, earning less
Anta Inventory (China)CNY 121.5 billion+13% YoY growth
Inventory Write-downsCNY 274 millionvs CNY 132M reversal in 2024
Cross-department Approval Time3 days averageCauses 30%+ delivery delays

Brand Responses & Strategic Shifts

Major global brands are actively restructuring their supply chain strategies in response to Southeast Asian manufacturing challenges:

  • Nike: Stock plunged 14% in one day following tariff announcements; ~50% of shoe production in Vietnam now at risk
  • Adidas: Significant Vietnam exposure (~39% of production); actively reducing orders from Vietnamese contractors
  • Puma: Vietnam production concentration creating cost pressures
  • Lululemon: ~42% production in Vietnam; highly exposed to regional risks
  • General trend: Brands flying to China to negotiate new contracts before tariff restoration

The "China Plus One" strategy is being reconsidered. Foreign investors are increasingly vocal: "China is more reliable." The decoupling narrative is facing reality checks as Southeast Asian alternatives prove less resilient than anticipated.

Market Outlook & Strategic Implications

Three Scenarios for Southeast Asian Manufacturing

ScenarioTimelineDescription
Optimistic: Full Recovery1-3 yearsSome orders return, but China retains 40-60% of newly gained volume
Base Case: Partial NormalizationOngoingLow-value products return to SEA; premium manufacturing stays in China
Pessimistic: Structural ContractionLong-termSEA textile industry contracts; China's competitive position strengthens permanently

Key Risks to Monitor

  • Geopolitical: Middle East conflict impact on global energy prices and supply
  • Trade Policy: US tariff uncertainty and potential restoration of higher rates
  • Operational: Continued power shortages and infrastructure constraints
  • Labor: Generational shift away from factory work toward gig economy
  • Compliance: Increasing ESG and audit requirements raising barriers to entry

Opportunities for Inventory Buyers

The current disruption creates unique opportunities for inventory buyers and surplus traders:

  • Distressed inventory from factory closures available at significant discounts
  • Canceled orders from major brands creating surplus stock in Vietnam and Cambodia
  • Quality control issues (reported 32% defect rate in some Vietnamese factories) creating secondary market opportunities
  • Chinese surplus market (Guangzhou Shisanhang) offering 40-60% gross margins on 尾货

For buyers like Tianjin Nice Partner Trading Co., Ltd., the current market presents a window to acquire quality apparel and footwear inventory at distressed prices, while Southeast Asian manufacturers struggle with overstock and cash flow pressures.

Data Sources & Methodology

This report synthesizes data from multiple sources including:

  • Bloomberg reports on Vietnam factory shutdowns and worker exodus
  • Vietnam Textile and Apparel Association (VITAS) industry data
  • China Customs export statistics
  • World Bank Cambodia economic assessments
  • IEA energy crisis reports and oil market analysis
  • Company financial reports (Anta, Fast Retailing/Uniqlo)
  • Industry trade publications and market intelligence

Report prepared: April 11, 2026 | For: Tianjin Nice Partner Trading Co., Ltd.

Special Report Southeast Asian Orders Returning to China — Two Shocks, One Destination
📅 April 8, 2026

Key Finding

Southeast Asian Apparel & Footwear Orders Have Confirmed Returning to China

Driver 1: US Tariff War (April 2025)
Driver 2: Middle East Energy Crisis (March 2026)
Two Independent Forces Superimposed — China Manufacturing Competitiveness Unprecedentedly Strengthened
Based on publicly available data as of April 2026 | For reference only

Core Analysis: Two Shocks, One Destination

Two independent shocks, same ultimate direction — Southeast Asian manufacturing suffered structural damage, and China has become the only reliable production haven for global brands.

Driver 1 — US Tariff War:
• Trump imposed 46% tariff on Vietnam
• Imposed 49% tariff on Cambodia
• Southeast Asia costs first exceeded China
• China US exports +18% MoM in May 2025
• Nike stock plunged 14% in one day
• 2 million Vietnam workers at layoff risk
• 1,300 Vietnamese enterprises on brink of bankruptcy

Driver 2 — Middle East Energy Crisis:
• Strait of Hormuz nearly shut down
• Global oil prices surged 55% in one month
• Southeast Asia reserves only 20-50 days
• China restricted fuel exports to protect domestic supply
• Vietnam, Cambodia, Bangladesh supply cut off
• Petrochemical chain disrupted (ethylene -12%)
• Southeast Asian factories forced to cut or stop production

Key Insights:
A — Tariff Shock: Southeast Asia previously relied on near-zero tariffs + FTA benefits + cheap labor for competitiveness. Tariffs broke this logic — China now more cost-competitive overall for the first time ever.
B — Energy Shock: Southeast Asia highly dependent on oil imports (80%+), and China is their main fuel supplier. War caused oil prices to surge + China restricted exports — a double blow.
C — Superposition Effect: Both shocks hit Southeast Asia simultaneously — tariffs made SEA more expensive, energy crisis made factories physically unable to produce. Brands have no choice.

Shock 1: US Tariff War (April 2025)

Tariff Rate Comparison (April 2025 vs Before)

Country / RegionApr 2025 TariffPrevious StatusChange
Vietnam46%Near-zero (FTA benefit)Major increase
Cambodia49%Near-zeroMajor increase
Thailand36%Near-zeroMajor increase
Bangladesh37%Relatively lowSignificant increase
China~50% (incl. existing)20%Major increase

Immediate Market Reaction (April 3, 2025)

IndicatorData
VN Vietnam Stock MarketCrashed 6.69% in a single day
NK Nike StockPlunged 14% in one day, market cap lost USD 10 billion+
AD AdidasPlunged sharply, Vietnam concentration risk exposed
WK Vietnam Workers2 million textile workers immediately at layoff risk
FD Vietnam FactoriesLarge-scale layoffs in Binh Duong and other manufacturing hubs
EN Vietnam Enterprises1,300 textile enterprises facing bankruptcy risk

Nike Supply Chain Impact (Most Representative Case)

BrandVietnam Prod. ShareExtra Tariff Cost (Est.)Retail Price Increase
Nike~50%Shoes costing ~700 yuan = +230 yuan extra tariff per pair30%+
Adidas~39%Significant cost increaseTBD
PumaSignificant concentrationSignificant cost increaseTBD
Lululemon~42%Highly exposed to Vietnam riskTBD

Note: ~50% of Nike shoes produced in Vietnam. Tariffs added approximately 230 yuan per pair in extra costs.

Before the tariff era: Vietnam labor 30% cheaper than China, but raw materials (80% from China) and logistics (+25%) offset the gap. Total costs still slightly higher than China — competitiveness only maintained via near-zero FTA tariffs. After the tariff era: Vietnam total costs now EXCEED China. This is the first time in history that Southeast Asian manufacturing has been directly outperformed by China.

Shock 2: Middle East Energy Crisis (March 2026)

Scale: Largest Oil Supply Disruption Since 1988

IndicatorData / DescriptionSource
Strait of HormuzNearly shut downMultiple sources
Middle East energy assets damaged40+, 9 countriesIEA
Brent crude oil surge+55% in one month (March 2026)IEA
Global oil demand impactApprox. -1 million bbl/dayIEA Monthly Report
Historical comparisonLargest since 1988IEA Executive Director
Extreme scenario warningOil could reach USD 150/barrelQatar Energy Minister

Southeast Asia Energy Vulnerability: 20-50 Days vs China 90+ Days

CountryFuel Import DependencyReserve DaysImpact Level
VietnamMostly imported~20-30 daysSevere
CambodiaNear 100%~20 daysExtremely severe
Bangladesh95%Critically lowExtremely severe
Sri Lanka99%Critically lowExtremely severe
PhilippinesMostly imported~30 daysSevere
ThailandPartially imported~30-50 daysModerate
China~70%90+ days (strategic reserves)Stable

Concrete Impact on Southeast Asian Countries (March-April 2026)

CountryImpact
VN VietnamRefinery operating rates down; China restricted diesel/gasoline exports; industrial fuel supply cut; factories forced to cut or stop production.
KH CambodiaFuel stations out of stock in Phnom Penh; fishing boats grounded; temples paused cremation services; factory shutdowns.
BD Bangladesh95% fuel import dependent; fertilizer factories idled; nationwide rolling blackouts; spring planting severely disrupted.
LK Sri Lanka99% fuel import dependent; government imposed fuel rationing; long lines at gas stations; public transport disrupted.
TH ThailandFactories forced to cut production; some production lines halted.
PH PhilippinesFuel stations out of stock; fishermen, tricycle drivers, truck drivers unemployed or out of work.

China Export Restrictions: The Second Blow

When global oil prices surged, China chose to prioritize domestic supply security and restricted refined fuel exports. This dealt a second blow to countries heavily dependent on Chinese diesel and gasoline: oil price surge + Chinese supply cut off simultaneously.

China Energy Resilience & Order Return Evidence

China Energy Security & Competitive Advantages:

01 — Oil Import Diversification: China reduced Middle East oil import share from 47% (2019-2023 avg) to 44.5% (2024); Russia became #1 supplier (~20%); Brazil and Canada growing rapidly as non-Middle East sources.

02 — Domestic Production Records: 2025: Crude oil 215 million tons (all-time high); natural gas output up 35%; 315 GW new solar installed (exceeds any country historical total); 119 GW new wind installed (equals Norway hydropower x4).

03 — Strategic Petroleum Reserves: China strategic reserves estimated at 90+ days of net imports; government actively releases reserves to stabilize prices during volatility.

04 — Petrochemical Supply Chain: 2026 global ethylene production expected to drop ~12%; China ethylene may decline ~5% but massive scale sustains supply; Southeast Asia ethylene may drop ~10%, compounding tariff damage.

Direct Evidence — Orders Returning to China:

D1 — China US Exports May 2025: China US exports surged +18% MoM; Citic Securities: "Orders previously shifted to SEA due to tariffs have begun returning to China." (May 15, 2025)

D2 — Yantian Port Data: Early April 2025 dropped nearly 50% due to tariff uncertainty; recovered quickly after tariff pause and continued growing.

D3 — US Buyer Actions: US buyers flew to China personally to negotiate new contracts, locking in orders before tariff restoration.

D4 — 2024 Full Year Data: China apparel exports to US: USD 49.36 billion, +8.08% YoY; China total textile exports: USD 301.1 billion, +2.8%.

D5 — Vietnam Factory Reality: Fengcheng Group announced mass layoffs and shift to Indonesia; Adidas and Puma Vietnam contractors began reducing orders.

Comprehensive Cost Comparison & Conclusions

Apparel Manufacturing Cost Comparison (After Two Shocks)

Cost FactorChinaVietnamCambodiaAssessment
LaborBase 1007055SEA still has advantage
Raw MaterialsBase 100130+140+China controls + export limits
LogisticsBase 100125+130+Oil prices up +55%
US Tariff~50%46%49%SEA similar to China
Energy CostBase 100155+155+Fuel shortages + oil price surge
Total Effective CostBase 150~175+~180+China advantage widened

Two Shocks Landing on Southeast Asian Factories

■ First Wave: US Tariff Impact (First Strike)

• Vietnam 46% tariff no longer makes Vietnam factories cheap; "near-zero tariff + FTA" competitiveness is gone
• Adidas, Puma etc. Vietnam contractors began reducing orders or shifting production
• Fengcheng Group announced 6,000 layoffs, shifting capacity to Indonesia

■ Second Wave: Middle East Energy Crisis (Fog-of-War Layer)

• Global oil prices up 55%, Southeast Asia reserves only 20-50 days — running out fast
• China prioritized petroleum supply for domestic use, restricted exports — Vietnam etc. hit hard
• Petrochemical raw materials cannot arrive on time, textile factories cannot sustain production
• Both shocks landed simultaneously on Southeast Asia — combined effect cannot be absorbed.
• Brands have no choice: only China.

Final Conclusions

ScenarioTime HorizonOutlook
A: Tariffs Fully Removed (Most Optimistic)1-3 yearsSome orders return to Vietnam, but China retains 40-60% of newly gained order volume
B: Partial Normalization (Current Reality)OngoingOnly labor-intensive low-value products return to SEA; premium products stay in China
C: Tariffs Remain Baseline (Most Likely)Long-termSEA textile industry contracts structurally; China competitive position in global apparel supply chain strengthened

Southeast Asian apparel & footwear orders have confirmed returning to China. Driver 1: US Tariffs (breaking the cost logic) + Driver 2: Middle East Energy Crisis (confirming and accelerating). The superposition of both makes China manufacturing competitiveness unprecedentedly strong — not weakened.

Data sources: IEA, China Customs, Vietnam Textile Association, Citic Securities, Tencent Finance, Toutiao, Caixin, WPC 2026 Conference, etc. As of April 2026.

DISCLAIMER: This report is based on publicly available information and data as of April 2026. All forecasts involve uncertainty. This report is for informational reference only and does not constitute investment or business decisions. Data cited from various countries and regions may differ in methodology; please refer to original sources.

Q1 2026 Report Europe Apparel & Footwear Inventory Industry — Q1 2026 Report
📅 April 6, 2026

Macro Background: Dramatic Shift in Trade Landscape

US Tariff Shockwave: The biggest external variable in Q1 2026 is the US "reciprocal tariff" policy, profoundly impacting the global apparel supply chain: Vietnam hit with 46% tariff, Cambodia 49%, Thailand 36%, Indonesia 32% — these countries are the core manufacturing bases for Nike and Adidas, facing supply chain rupture risks. ECB Executive Board member Isabel Schnabel warned: "This is the most dangerous trade policy shift since WWII."

European Brands' Responses: Zalando announced accelerated expansion; Hugo Boss urgently redirected China-manufactured products originally destined for US to other markets; multiple European brands actively transferring inventory from US channels to Middle East, Southeast Asia, South America.

European Apparel Retail Market — Current Status

Luxury Segment: 2025 saw 96 new luxury store openings across Europe's main shopping streets, up 13% YoY. But top brands show divergent performance: LVMH weak Christmas sales; Gucci sales down 10% YoY. Prime retail space scarce, rents up 3.5%.

Mass Market Segment: Industry remains focused on de-stocking; overcapacity not yet fundamentally resolved. ZARA and fast-fashion players leveraging rapid response capability to dominate. Small and medium brands facing survival crisis.

UK Market: Nearly half of UK retailers still face excess inventory after Christmas and January sales. 44% of sellers still have unsold merchandise after the January clearance season. UK retailers hold an average of £65,000 in excess inventory. 59% say failure to sell excess inventory will endanger cash flow.

European Footwear Market Data

EU is the world's second largest footwear import market. 2022 EU footwear imports reached $17 billion, up 11.3% YoY. Finished footwear imports: 2.14 billion pairs, worth $15.2 billion. Leather footwear dominates: 630 million pairs, worth $8.9 billion. European sports goods market expected to reach $231.39 billion by 2026 (CAGR 6.12%).

Inventory & Liquidation Market Opportunities

Causes of Current Inventory Glut: Slowing consumer demand, US tariff redirects, fast fashion buildup, returns tsunami.

Implications: UK, Germany, France have the most concentrated excess inventory — abundant liquidation opportunities. European brands actively transferring inventory to other markets — intermediary opportunity window opening. Sustainable apparel demand rising, expected to reach 6%+ of market by 2026. ⚠️ EU tightening import apparel tariff policies — advance understanding of HS code applicable tariff rates required.

Knowledge Guide Apparel & Footwear Inventory Industry — Quick Knowledge Guide
📅 April 4, 2026

Common Types of Inventory

End-of-Season StockUnsold items from current season; difficult to sell next season
Clearance GoodsFinal batch released by brands/retailers to clear warehouse space
Returned GoodsItems returned by consumers; may show minor signs of use
Liquidation GoodsInventory that needs to be converted to cash quickly
Factory SurplusUnits produced beyond the original order quantity

Inventory Pricing Logic

MSRP — Brand's recommended retail price, used as reference baseline. Cost Price — Typically 15%–30% of MSRP. Liquidation Price — Generally 10%–40% of MSRP. The more urgent the sale, the lower the price. Wholesale Price — Falls between cost and retail. Typically 40%–60% of MSRP.

💡 Industry Rule: Bigger brand + newer goods + complete size run = higher price. Broken sizes, mixed lots command lowest prices.

5 Must-Ask Questions When Sourcing

  1. WHERE IS THE STOCK? — Warehouse location affects freight costs and customs clearance.
  2. IS THERE A MANIFEST? — Per-item packing list prevents "mystery box" purchases.
  3. WHAT IS THE SIZE BREAKDOWN? — Broken sizes directly impact how easily you can move the goods.
  4. IS THERE BRAND AUTHORIZATION? — Genuine branded inventory requires authorization for legal resale.
  5. PAYMENT & PICKUP TERMS? — Determines how risk is allocated.
Industry Guide The Brand Stock & Surplus Apparel Industry in 2026: A Complete Guide
📅 April 2, 2026

What Is Brand Stock Apparel?

Brand stock apparel — also referred to as surplus stock or 尾货 (weihuo) — is brand-new clothing that brands, manufacturers, distributors, or retailers fail to sell through primary channels. It exists because of overproduction, seasonal turnover, channel mismatch, or brand exits from markets.

Market Scale & Growth (2025–2026)

2026E women's stock apparel market¥120 billion (~$16.5B USD)
2026 YoY growth rate12%
Fast fashion surplus share45%
Premium/high-end surplus share30%

Source: China Garment Association Q1 2026 Report

2026 Key Data Points

  • Clearance cycle shortened by 37% — supply chain agility is now a core competitive edge
  • Live commerce accounts for 40%+ of stock sales
  • 68% of traditional wholesalers face survival pressure from live streaming disruption
  • Tag-price discount floors at 10–20% for bulk buys; premium brands may reach 30–50%
  • Export surplus growing via SHEIN, Temu, AliExpress

Common Risks

  • "Ghost Delivery" — Fake logistics tracking numbers after deposit payment
  • "Quality Bait-and-Switch" — Sample quality high, bulk delivery contains damaged goods
  • "Sourced-from-Refuse" Fraud — Used clothing relabeled as "brand surplus"

⚠️ Golden Rule: Always verify goods in person before bulk payment. Use trusted intermediaries with established track records.

Industry Brief Brand Footwear & Apparel Inventory Landscape (2025–2026)
📅 April 1, 2026

Current Inventory Dynamics

The industry is navigating a high-inventory environment with significant divergence across segments. While major sportswear brands like Nike continue aggressive inventory clearance in key markets like Greater China (inventory down 11% YoY in FY2025Q4), many traditional apparel companies face severe overstock challenges. Listed firms such as HLA (inventory days: 330) and Jinhong Group (inventory days: 355) are grappling with record-high stock levels.

Mounting Cost Pressures

Oil price volatility is directly elevating production costs. Since December 2025, crude oil prices have surged over 30% due to Middle East tensions. Key synthetic fibers like polyester and nylon have seen prices spike, with upstream chemical companies announcing price hikes of 50–80%. Every $10/barrel oil increase raises footwear manufacturing costs by 2–3%.

Strategic Implications

  • Cost Forecasting: Anticipate continued raw material cost pressure through 2026
  • Inventory Sourcing: Opportunities in overstock/liquidation channels as brands accelerate clearance
  • Supplier Selection: Prioritize partners with strong supply chain control
  • Category Focus: Sportswear and outdoor inventory may offer better turnover

The industry is transitioning from volume-driven growth to value-driven, inventory-efficient operations.

↓ Scroll for more articles

Trusted Wholesale Partner Since Day One

Verified business, real inventory, global delivery.

Business License
🗡

Business License

Tianjin Nice Partner Trading Co., Ltd.

Registered & Verified

Warehouse & Customer Photo
🛒

On-Site with Customers

Warehouse & shipment inspection

Real business, every day

Nice Partner Trading Co., Ltd. is a registered wholesale company based in Tianjin, China — specializing in authentic sports brand liquidation, closeout inventory, and premium stock clearance. We source directly from brand distributors, factory overstock, and authorized liquidators.

🗡

Registered Company

Business license verified — legally operating wholesale company

📦

427,000+ pcs Ready

Current in-stock inventory across multiple brands

🌍

30+ Countries

Serving retailers worldwide with reliable logistics

💰

Best Price Guaranteed

Direct sourcing means up to 96% off retail prices

In-Stock Inventory, Ready to Ship

Browse our current wholesale stock across three categories. Click any product to view full details and images.

For products listed more than one month ago, please contact our administrator to confirm they are still available.

Product NameBrief PreviewPriceDate
NIKE
Authorized Clearance — 2,921 SKUs | 535,627 units | $14.39M Wholesale
Tap for details ↓
75% off retail
2026-05-12
Brand NIKE — Authorized Clearance Stock, 3rd Batch
Total Stock 535,627 units | 2,921 SKUs
Total Wholesale Value $14,389,003 USD
Pricing $2.17 – $643.35 FOB | 75% off retail
Retail Range (USD) $8.68 – $2,573.38
Season Before 2025 (376,829 units) | 25-26Y (158,798 units)
Categories Apparel 447,378 pcs (8,362 lines) | Footwear 84,687 pairs (1,783 lines) | Accessories 3,562 pcs (92 lines)
Top Series NIKE SPORTSWEAR 133,711 | JORDAN OFF CRT BBALL 68,662 | BASKETBALL 63,007 | WOMENS TRAINING 51,085 | RUNNING 18,187 | ACG 15,845 | NSW WOMENS 15,802 | NIKE ENERGY 14,000 | SOCCER 12,355 | SKATEBOARDING 9,946
Apparel Highlights SLEEVELESS TOP (up to 13,356 pcs/SKU) | LONG SLEEVE TOP (13,209 pcs) | FULL LENGTH PANT | ANKLE LENGTH TIGHT | SHORT SLEEVE T-SHIRT | WAIST LENGTH JACKET | MID THIGH SHORT | TANK TOP | LONG SLEEVE HOODED JACKET | ANKLE LENGTH PANT
Footwear Highlights LOW TOP (Soccer, Skateboarding, Running) | HIGH TOP (Soccer cleats) | Running shoes | Basketball shoes | Training shoes | Kids athletic shoes
Size Range Apparel: S–4XL | Footwear: US 4C–15 (Kids to Adult) | Accessories: Various
Grade / Authorization Authorized Original Stock | Licensed Export Compliance Guaranteed | All items marked with Remark "Y"
MOQ Contact for details
Note 3rd batch special clearance from authorized channels. 2,601 high-quality product images available for reference. Mix of classic and current season stock. Full-size runs available across most SKUs. Contact us for the complete inventory list with exact pricing per SKU.
ASICS
2026 New Season — 165 SKUs | 22,158 pairs | 26Q1 Priority
Tap for details ↓
~50% off Retail
2026-05-10
Brand ASICS — 2026 New Season Original Stock
Total Stock 22,158 pairs | 165 SKUs
Total Wholesale Value $1,397,128 USD
Pricing $6.62 – $138.97 FOB | ~50% off Retail
Retail Range (CNY) ¥90 – ¥1,890
Season 26Q1 (124 SKUs, 18,766 pairs) | 25Q3 (41 SKUs, 3,392 pairs)
Gender Unisex 80 | Man 50 | Woman 35 SKUs
Categories Running Shoes 12,223 pr (85 SKUs) | Sports Casual 3,846 pr (17 SKUs) | Apparel 4,485 pcs (45 SKUs) | Accessories 509 pcs (18 SKUs)
Running Shoes NOVABLAST 5, GEL-KAYANO 32, GEL-NIMBUS 28, GT-1000 14, GT-2000 14, GEL-Trabuco 13, GEL-QUANTUM 360, GEL-1130, GEL-NYC, JOG 100, SKYHAND OG, GEL-CUMULUS 28, GEL-EXCITE 10, GEL-PULSE 16, PATRIOT 14, DYNAFLYTE 5 and more
Apparel Short-sleeved T-shirts 1,740 pcs | Shorts 1,255 pcs | Down Jackets 326 pcs | Long-sleeved T-shirts 760 pcs | Cotton Coats 587 pcs | Vests 287 pcs | Socks 238 pairs | Hats 223 pcs | Bags 224 pcs and more
Size Range Shoes: US 4–12 (EU 36–48) | Apparel: S–3XL
Grade / Source Grade A Authentic | Original Brand Stock
MOQ Contact for details
Note Premium Japanese athletic brand. New 2026 season stock with full size runs available. 2026 Q1 items dominate the inventory (18,766 pairs, 124 SKUs). Includes performance running shoes, lifestyle sneakers, and technical apparel. Contact us for the complete inventory list and exact pricing per SKU.
ADIDAS
Original Stock — 33,716 pcs | 16% of Retail
Tap for details ↓
16% of Retail
2026-04-16
BrandAdidas — 100% Authentic Original Stock
Total Stock33,716 pcs (estimated)
Pricing16% of Retail Price
CategoriesHoodies 4,781 | Pants 4,035 | Jackets 3,755 | Shoes 2,947 | Coats 1,156 | Sets 485 | Others 16,557
Sub-BrandsAdidas Original 14,288 | Adidas Sports 12,990 | Kids 3,321 | Adidas Neo 1,572 | Mens 543 | Bags 4
GenderUnisex 97.8% | Kids 2.0% | Others 0.2%
Size RangeAdult: S-XXL | Kids: 3-5 | Shoes: US 3.5-5 (sample sizes)
Grade / SourceGrade A Authentic | Original Brand Stock
Wholesale ValueContact for pricing details
MOQContact for details
NoteMulti-category inventory including apparel, footwear, and accessories. Partial data from pivot table format. Contact us for complete SKU-level inventory breakdown and exact pricing.
SKECHERS
Original Stock — 61,649 pcs
Tap for details ↓
$5.48–$27.55/pc
2026-04-14
BrandSkechers — 100% Authentic Original Stock
Total Stock61,649 pcs | 245 SKU
Total Value$1,272,189 USD wholesale value
Pricing$5.48–$27.55/pc FOB (20–96% off retail)
Retail Range¥299–¥1,499 (avg ¥636)
CategoriesFootwear 55,634 | Apparel 5,752 | Accessories 263
GenderWomen 43,914 | Men 16,214 | Unisex 1,068 | Kids 448 | Girls 5
Top StylesHiking Shoes 12,960 | D'Lites Panda 9,709 | Go Walk 8,605 | D'Lites Plush 6,806 | Casual Shoes Plush 5,609 | 7/24 Series 3,563 | Work Shoes 3,163
Seasons24Q4 21,989 | 24Q1 18,328 | 24Q3 12,271 | 24Q2 2,332 | 23Q3 2,500 | 23Q4 2,024
Size RangeUS 5–13 (Full Size Run available)
Grade / SourceGrade A Authentic | Original Brand Stock | Full Size Runs
MOQContact for MOQ details
NoteComplete SKU-level data available. Mix of seasons (24Q1–24Q4 dominant). Contact us for the full inventory breakdown and pricing.
LACOSTE
Original Stock — 14,273 pcs
Tap for details ↓
20% of Retail
2026-04-09
BrandLacoste — 100% Authentic Original Stock
Total Stock14,273 pcs
Pricing20% of Retail Price (verified wholesale)
CategoriesFootwear 6,234 | Leather Goods 1,604 | Textile 1,909 | Caps 899 | S\S Polo 726 | Pants 292 | Dress 263 | Kids 184 | Tracksuit 183 | Sweatshirt 182 | Sweater 154 | Shorts 148 | Socks 99 | L\S Polo 50 | Woven Shirt 88 | Jackets 67 | Others 401
GenderMEN | WOMEN | UNISEX
StylesOLP Watches & Eyewear | S\S Polo | L\S Polo | T-Shirts | Sweatshirts | Tracksuits | Pants | Shorts | Dresses | Jackets | Down Jackets | Leather Bags | Caps | Socks | Kids
Size RangeONE SIZE / US 6–13 (Full Size Run)
Grade / SourceGrade A Authentic | DTC Channel Clearance | Partial Original Box & Tags
Wholesale Range$25–$67/pc (varies by category & style)
MOQMinimum 13,000 pcs per order
NoteDTC-authorized original stock. Full batch or split-shipment available. Contact us for the complete SKU list and pricing breakdown.
UNDER ARMOUR
Original Stock — 351,257 pcs
Tap for details ↓
$4.94–$81.84/pc
2026-04-08
BrandUnder Armour — Men's, Women's & Youth Sports Apparel & Footwear
Total Stock351,257 pcs
PricingWholesale at 16% of Retail — Factory-Direct Pricing
CategoriesSports Bras, Performance Tees, Shorts, Leggings, Fleece, Outerwear, Running Shoes, Training Shoes, Sandals
GenderMEN | WOMEN | YOUTH
StylesTraining, Running, Golf, Hunting, Outdoor, Casual, Team Sports
Size RangeFull size run available per style (XS–3XL / US 5–15)
Grade / SourceGrade A Authentic | Overstock Clearance
Wholesale Range$4.94–$81.84/pc
MOQMinimum 5,000 pcs per style; flexible for mixed lots
NoteFrom authorized Under Armour channels. Mixed lots include current season and carryover styles. Full batch or split-shipment available. Contact us for the complete SKU list, size breakdown, and pricing details.
REEBOK
Original Stock — 70,097 pcs
Tap for details ↓
$0.72–$64.16/pc
2026-04-07
BrandReebok — 100% Authentic Original Stock
Total Stock70,097 pcs across 1,403 SKUs
Pricing$0.72–$64.16/pc wholesale (avg $13.22/pc)
Total ValueEst. $877,096 wholesale value
GenderUnisex 37,416 | Womens 17,611 | Kids 10,248 | Mens 4,822
Top ProductsDMX SERIES 1200 LT Vintage Runner 7,016 | Kids Knit Pants 2,674 | Royal Bridge 3 Classic 2,513 | Club C Revenge Vintage 2,306 | Kids Fleece Pants 2,142 | Kids Hoodie 1,687
CategoriesFootwear 45,000+ | Apparel 25,000+ (T-shirts, Pants, Hoodies, Shorts)
Colors45+ colors available including Multicolor, Black, White, Red Brown, Grey, Blue, Green
Grade / SourceGrade A Authentic | Brand Channel Clearance
NoteDirect from Reebok authorized channels. Full batch or split-shipment available. Contact us for the complete SKU list and pricing details.
GUESS
48,517 pcs
👕 👖 👗 👟 👜
Tap for details ↓
Contact for Pricing
2026-04-07
BrandGUESS — 100% Authentic Original Stock
Total Stock48,517 pcs across 756 SKUs
Retail Price$9.94–$432.13 (avg $135.50)
GenderWomens 44,701 | Mens 3,547 | Girls 142 | Boys 127
Top CategoriesDress 14,215 | T-shirt 9,789 | Sweater 5,594 | Jeans 5,207 | Shorts 2,781 | Shirt 1,861
SeasonSS 37,124 | AW 11,393
ColorsBlack 10,134 | Blue 5,515 | Grey 4,600 | White 3,346 | Light Blue 1,891 | Pink 1,853 | Dark Blue 1,624
Size RangeFull size run available per style
Grade / SourceGrade A Authentic | Brand Channel Clearance
NoteDirect from GUESS authorized channels. Full batch or split-shipment available. Contact us for the complete SKU list, size breakdown, and pricing details.
Product NameBrief PreviewPriceDate
FILA RUNNING SHOES
Running Shoes — 42,000 pairs | 8 Models | Fixed Price Clearance
Tap for details ↓
$9.80/pr
2026-05-29
BrandFILA — Authentic Original Stock
Total Stock42,000 Pairs | 8 Models | 4 Groups (Men's Lite, Women's Lite, Men's R LITE, Women's R LITE)
Total Value$411,600 USD wholesale value
Pricing$9.80/pair EXW (Fixed Price)
Retail Range$80–$150 USD
Discount~85% off retail
MOQ21,000 pairs (negotiable)
ConditionGrade A Original Stock | 2026 Season
LEVI'S CANVAS SHOES
Black & White Tie-Dye Collection — 5,105 pairs | Fixed Price Clearance
Tap for details ↓
$3.80/pr
2026-05-15
Brand Levi's — Authentic Original Stock
Total Stock 5,105 Pairs | Black & White Tie-Dye
Total Value $19,399 USD wholesale value
Pricing $3.80/pair EXW (Fixed Price)
Retail Range $35–$65 USD
Discount ~85% off retail
Categories Canvas Shoes / Slip-On
Gender Unisex
Colors Black & White Tie-Dye
Size Range 34#–45# (European Sizes)
Grade / Source Grade A Authentic | Authorized Clearance
Date Added 2026-05-15
LACOSTE POLO
Authentic Polo Shirts — 6,000 pcs | Fixed Price Clearance
Tap for details ↓
$6.50/pc
2026-05-09
Brand Lacoste — Authentic Original Stock
Total Stock 6,000 Pieces | Multiple Colors
Total Value $39,000 USD wholesale value
Pricing $6.50/pc EXW (Fixed Price)
Retail Range $89–$169 USD
Discount ~90% off retail
Categories Polo Shirts / Classic Fit
Gender Men & Women
Colors White, Navy, Black & More
Size Range S–XXL (Full Size Run)
Grade / Source Grade A Authentic | Original Brand Stock with Tags
MOQ 100 pcs/color
Note Authentic Lacoste classic polo shirts with original tags. Premium cotton piqué fabric. Iconic crocodile embroidery. Fixed clearance price at $6.50/pc — unbeatable value for authentic branded stock. Contact us for the full inventory list and pricing.
MIZUNO
Running Shoes — 1,756 Pairs | 12 Colors
Tap for details ↓
$15.50/pr
2026-05-05
BrandMizuno — Authentic Original Stock
Total Stock1,756 Pairs | 1 SKU
Total Value$27,218 USD wholesale value
Pricing$15.50/pr EXW (Fixed Price)
Retail Range$89.99–$189.99 USD
Discount~83% off retail
CategoriesRunning Shoes
GenderUnisex
ColorsBrown, Grayish Brown, Beige, Mihai Silver, Black & Green, Black Silver, Black, Light Gray, White, Black & Gray, Grey, Blue
Size RangeEU 40–46
Grade / SourceGrade A Authentic | Original Brand Stock
MOQ50 pairs/size
NotePremium running shoes from Mizuno. 12 color options available. Sizes EU 40-46. Fixed wholesale price. Contact us for the full inventory list and pricing.
DICKIES
Original Stock — 9,862 pcs | 35 SKU
Tap for details ↓
$9.50/pc
2026-04-14
BrandDickies — Authentic Original Stock
Total Stock9,862 pcs | 35 SKU
Total Value$93,689 USD wholesale value
Pricing$9.50/pc EXW (Fixed Price)
Retail Range$80.55–$215.99 USD
Discount~94% off retail
CategoriesBoots & Shoes (Work & Fashion)
GenderMen 14 SKU | Women 21 SKU
ColorsBlack 25 | Beige 3 | Coffee 2 | Pink/Brown/Khaki/Grey/White 1 each
Top Products204W50LXS83: 1,545 pcs | 204W50LXS83M: 1,044 pcs | 194W50LXS5F: 781 pcs | DKCMS1105D: 530 pcs
Grade / SourceGrade A Authentic | Original Brand Stock
MOQContact for details
Note35 SKU-level products available. Fixed wholesale price for all sizes. Mix of men's work boots and women's fashion boots. Contact us for the full inventory list and pricing.
Product NamePriceDate
KIDS SPORTSWEAR SET
Children's Activewear — 40,000 Sets | MOQ 10,000
Tap for details ↓
$2.00/set
2026-05-19
ProductChildren's Sportswear Set — Long-Sleeve Top + Pants
Total Stock40,000 Sets Available
Price$2.00 per set (wholesale)
MOQ10,000 sets (minimum order)
SeasonFall & Winter Collection
GenderKIDS (Boys & Girls)
MaterialTop: 61% Polyester / 36% Cotton / 3% Spandex
Pants: 90% Polyester / 10% Spandex
Grade / SourceFactory Direct Stock — Ready in Warehouse
KIDS PAJAMAS SET
Children's Sleepwear — 6,400 Sets
Tap for details ↓
$2.50/set
2026-04-19
ProductChildren's Pajamas / Sleepwear Set
Total Stock6,400 Sets
Price$2.50 per set (wholesale)
CategoriesChildren's Sleepwear / Homewear
GenderKIDS (Boys & Girls)
StylesPajama Sets, Homewear Suits
Grade / SourceGrade A — Factory Direct Stock
MOQContact us for details

Why Retailers Choose Nice Partner

We're not just a supplier — we're a long-term partner committed to your success.

🟠

100% Authentic Products

Every item is sourced from authorized distributors. No counterfeits — guaranteed.

💰

Below-Wholesale Pricing

We work directly with liquidators to bring you prices that beat traditional wholesale.

📦

Flexible MOQ

Start with a single mixed pallet or scale up to full container loads. You choose.

🚚

Global Logistics

We ship to 30+ countries with reliable tracking and competitive rates.

🔒

Quality Control div>

We inspect every shipment before dispatch. Your reputation is on the line with every sale.

💬

Dedicated Account Manager

A real person on WhatsApp and email — quick responses, transparent pricing.

Ready to Stock the Best Sports Brand Inventory?

Get in touch today for pricing, availability and a custom quote tailored to your business.

Let's Talk Business

Send us a message and our team will respond within 24 hours with pricing and availability.

Send a Message

Fill in the form below and we'll get back to you shortly.